- Insights
- Utilisation Report
Utilisation Report
You can find the Utilisation report by navigating to the Reports page in Astalty and clicking Utilisation.
Report Overview
This report will show all Services for your Participants and utilisation data for those Services.
If you don't have access to view all Participants, you will only see your assigned Participants in this report.
Filters
Management Type
Filter the report to show only services with a particular plan management type. Choose any combination of NDIA, Plan and Self Managed.
The filter works at the service level, so participants whose plans mix management types are shown accurately — only the services that match your selection appear. This filter is available on both the All Participants and My Participants views.
Service Category
Refine your search by the NDIS Support Category under which a service falls. This helps you quickly focus on the types of support you’re interested in tracking.
Team Member, Primary Coordinator & Service Coordinator
Three separate filters let you focus the report on the participants a particular team member looks after. Each one uses the coordinator roles explained in Primary vs Service Coordinators:
- Team Member — services for every participant the team member is linked to as either the Primary Coordinator or a Service Coordinator. Use this for a complete view of everything they touch.
- Primary Coordinator — only the participants the team member is the main coordinator for. Use this to review a team member's own funding utilisation without the participants they're only covering as a Service Coordinator getting mixed in.
- Service Coordinator — only the participants the team member covers as a Service Coordinator on one or more services.
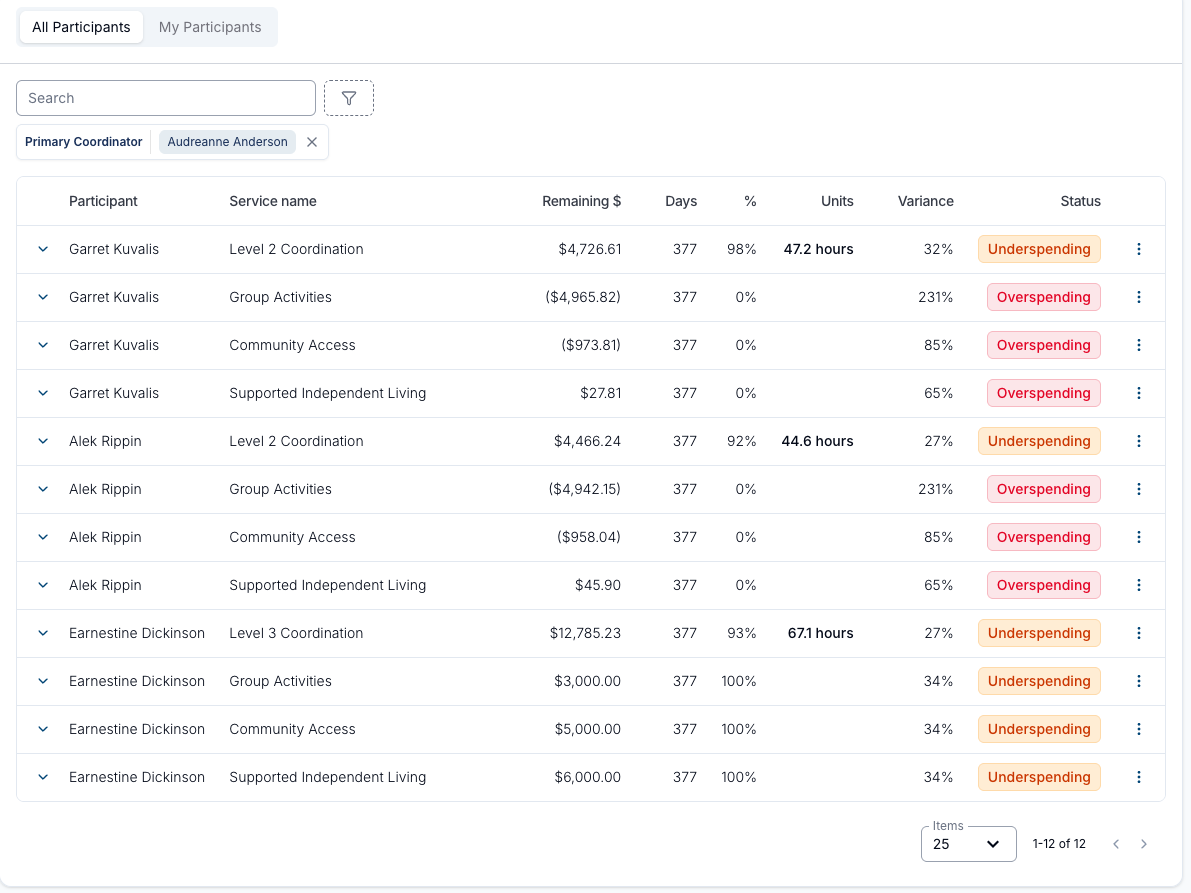
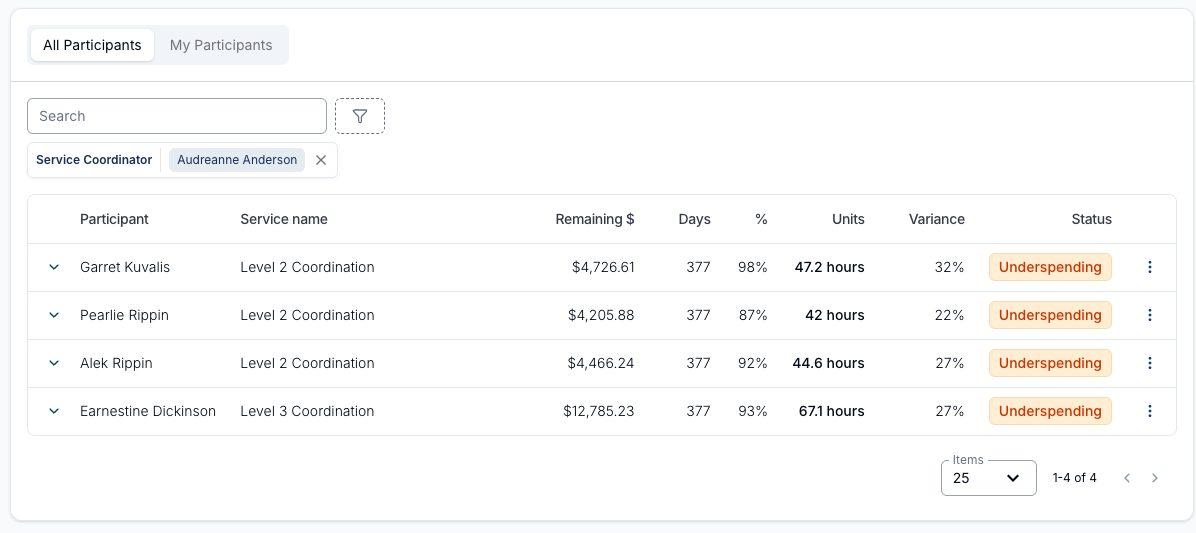
These coordinator filters are available on the All Participants view when you can view all participants.
Team
Display all service utilisations linked to the team members within one or more teams, giving a clear view of funding utilisation across multiple staff members.
Report Columns
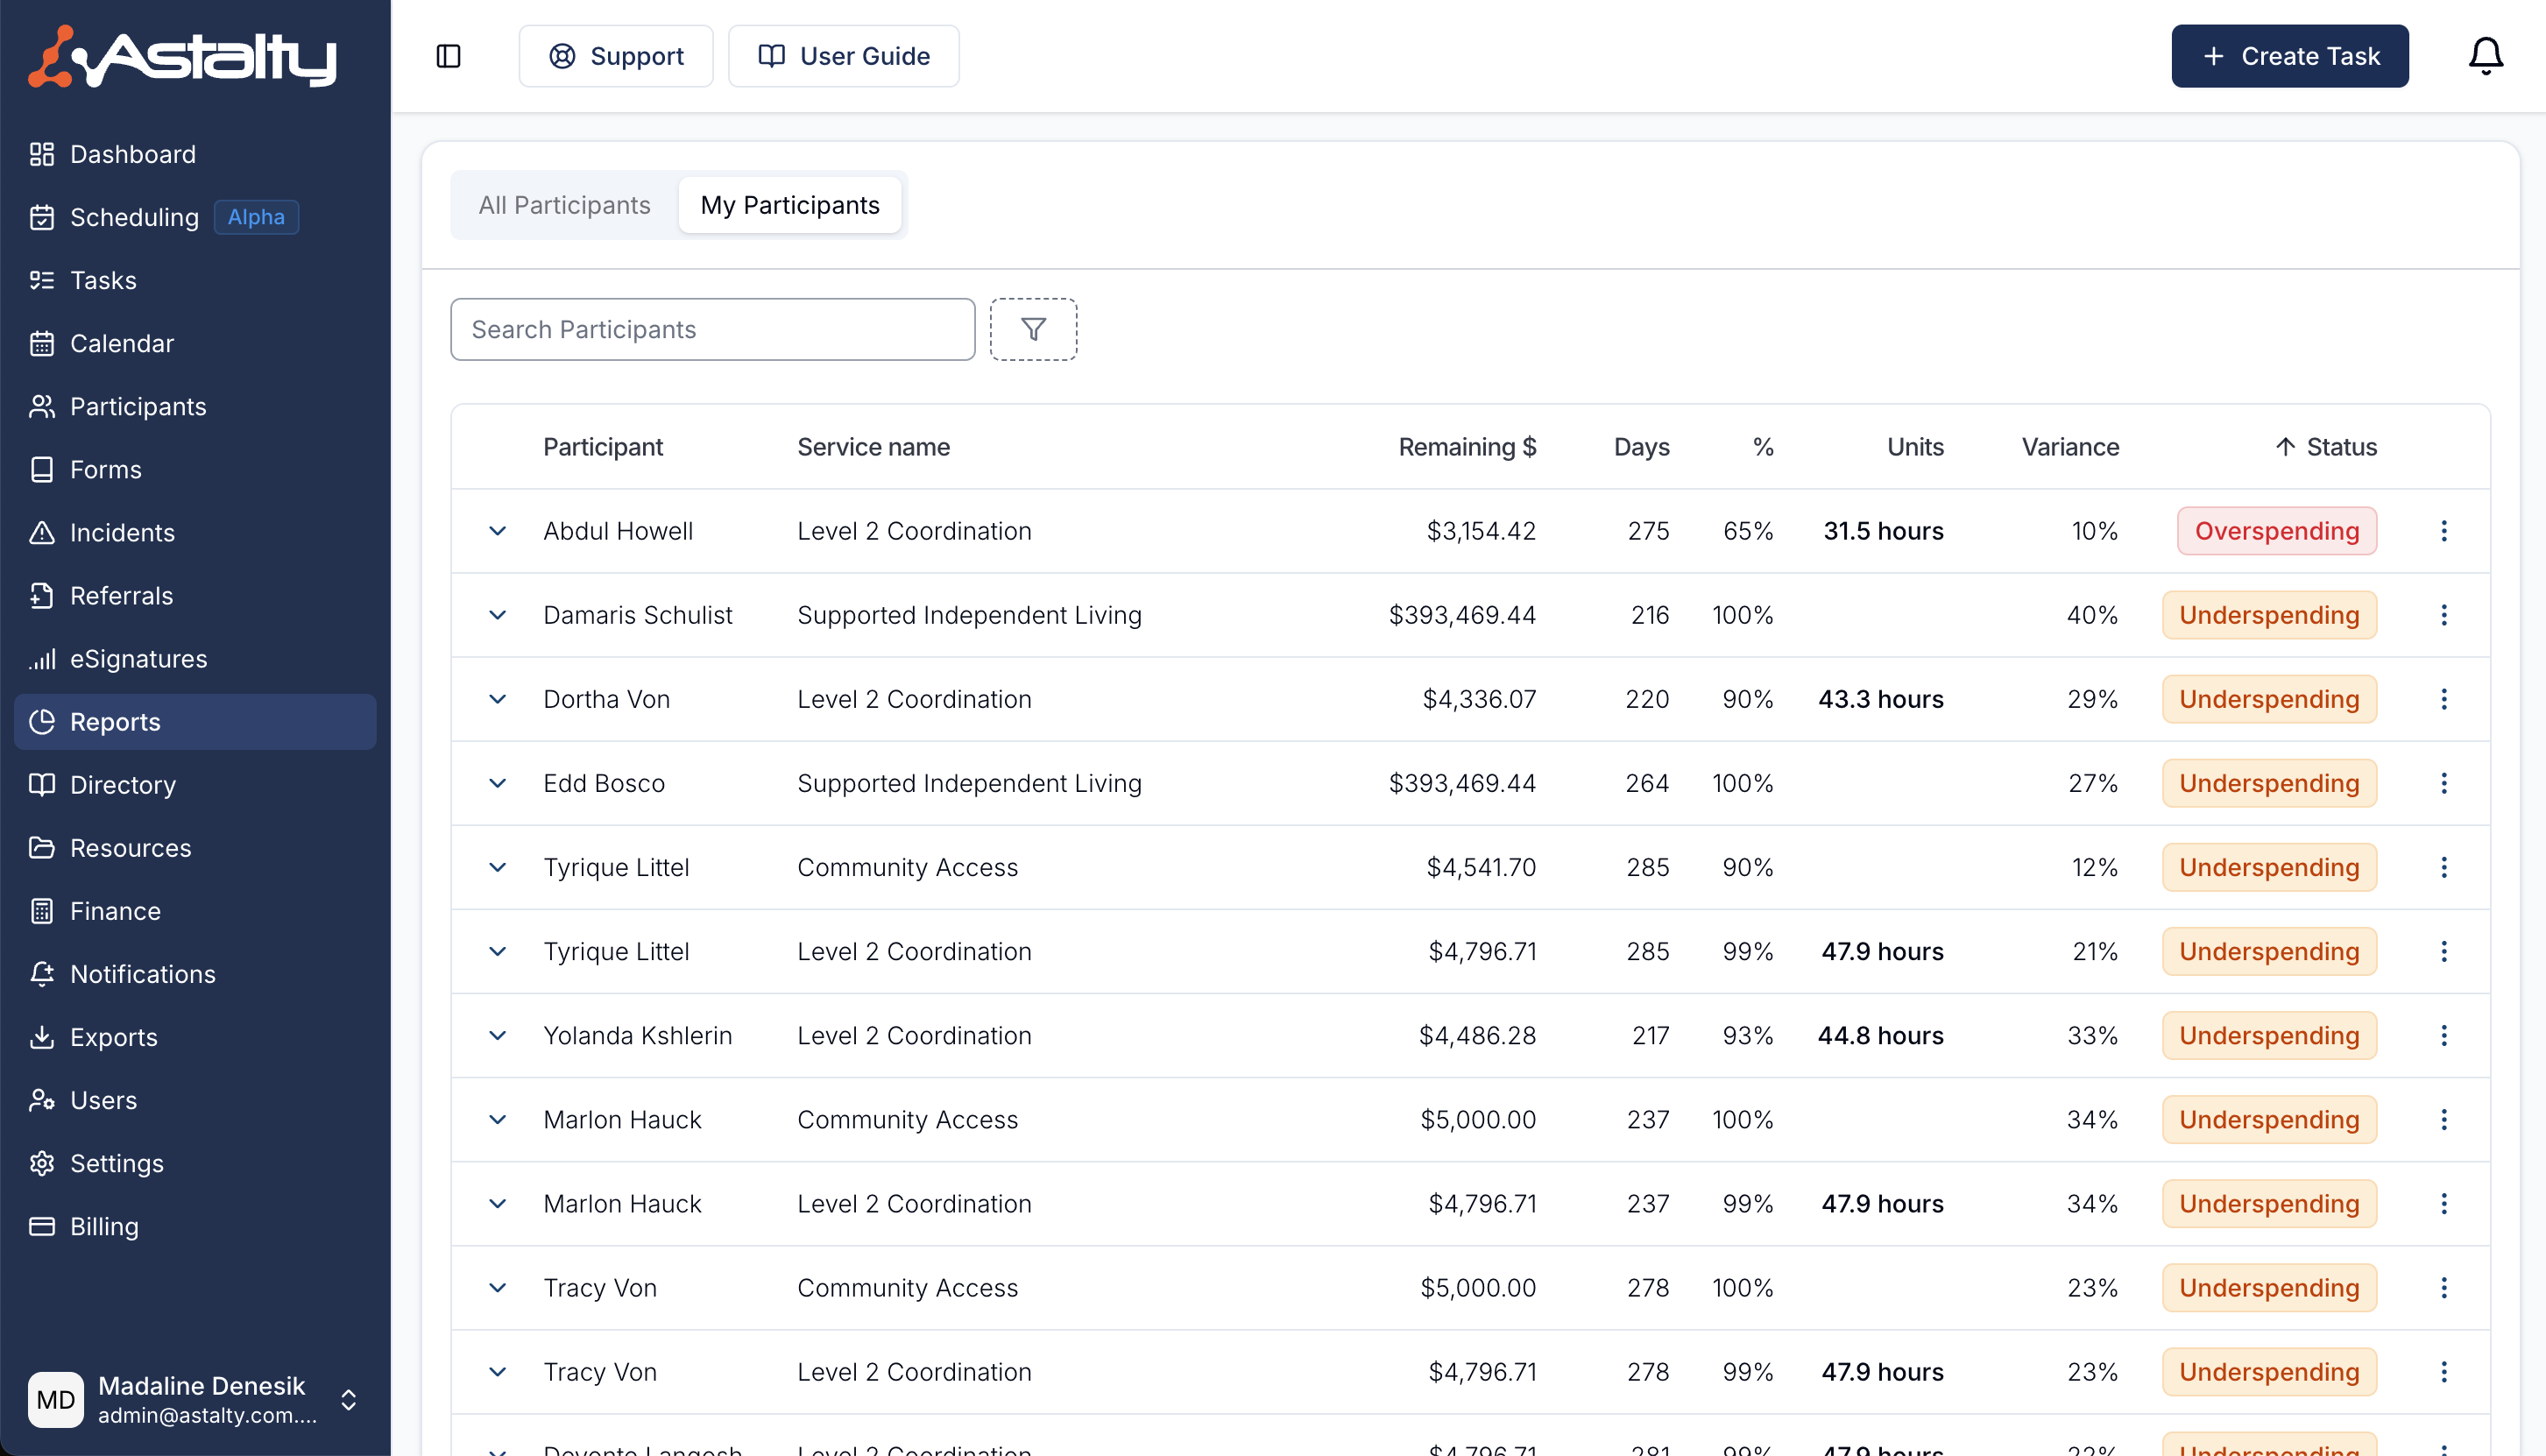
Participant
This is the name of the Participant for this Service.
Service Name
The name of the Service.
Type
The plan management type for the Service — NDIA, Plan or Self Managed. Because this is shown per service, a participant with a mix of management types will have the correct type displayed against each of their services.
Remaining $
The amount remaining in the Service in dollars.
%
The amount of funding remaining in the Service as a percentage.
Units
The number of units remaining in the Service. This is calculated using the Calculate Remaining Units Using field when the Service is set up. The most common value to see here is hours but you mean see units which would be used for things like kilometres.
Utilisation Variance
The Utilisation Variance % is the difference between how much of the funding has been used and how much of the plan has elapsed.
For example if the plan is 2 years and 1 year has elapsed, the plan is 50% elapsed. If 80% of the funding has been used, then the variance would be 30%.
Status
The status indicates of the Participant's funding for that service is being overspent or underspent.
If the remaining funds % is less than the plan time % remaining, the Participant is overspending - this means they will run out of funds before the plan ends.
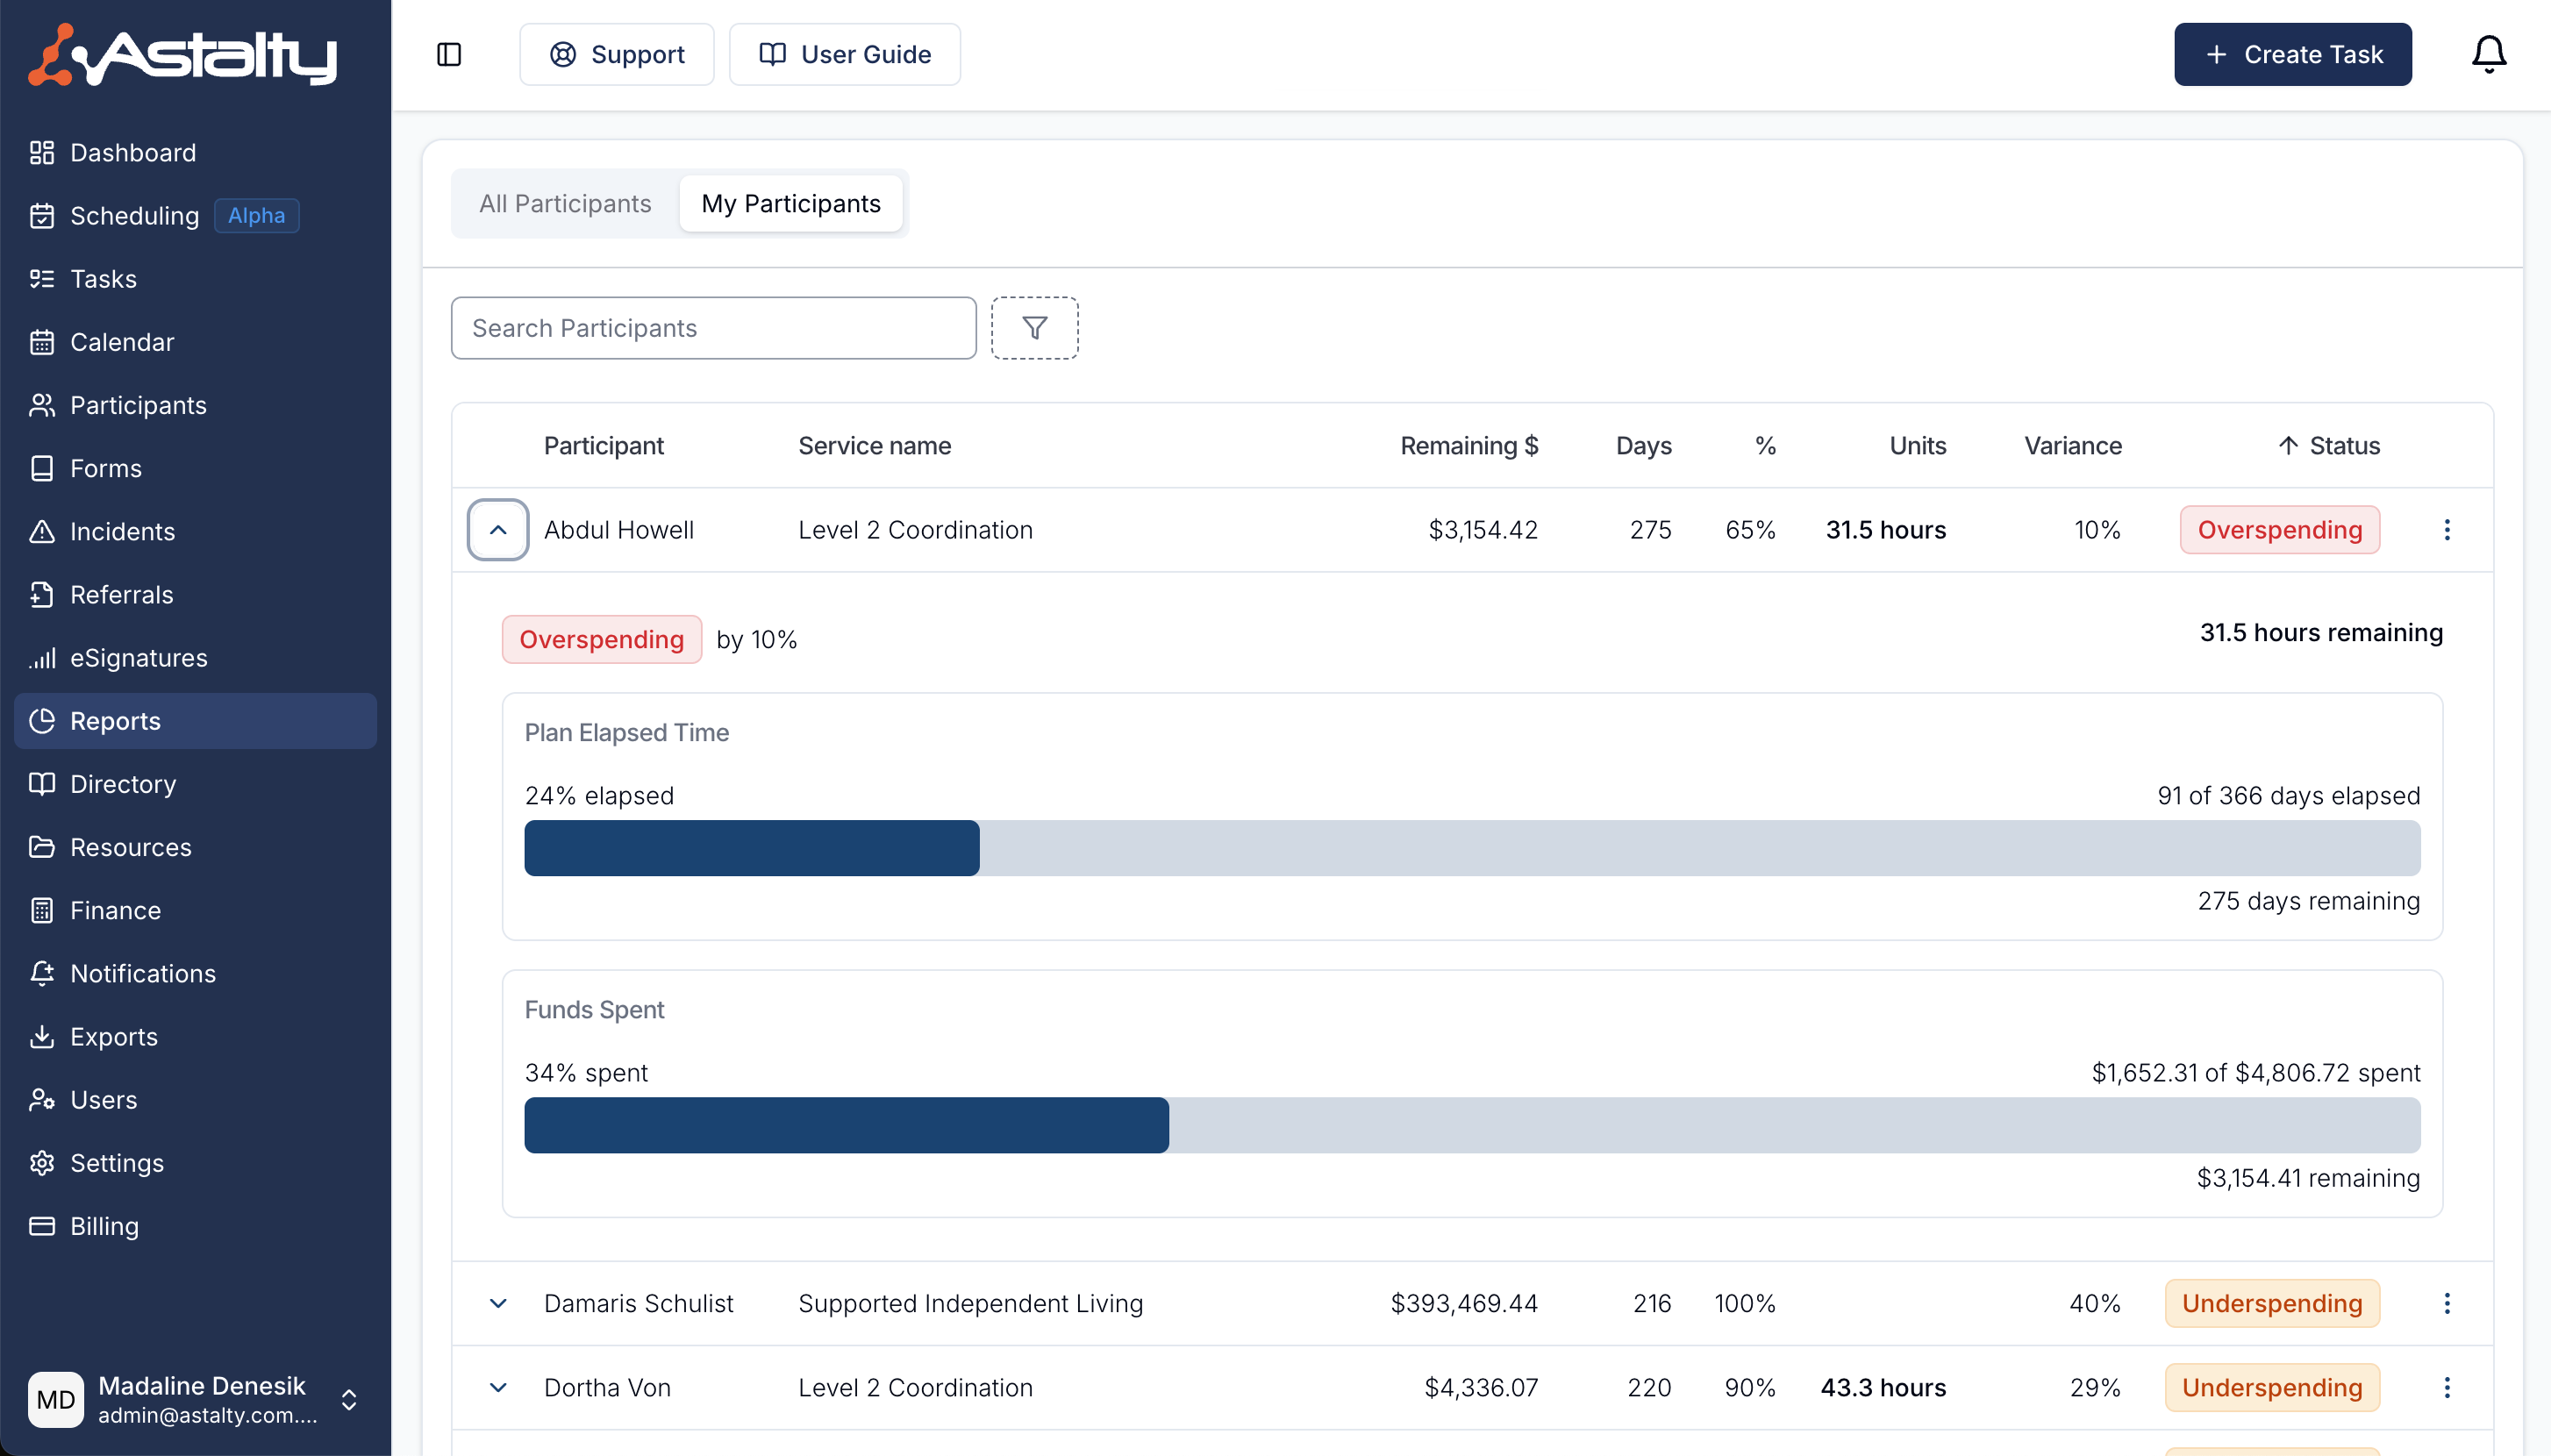
Detailed View
To view a graph showing utilisation and plan elapsed time click on the down arrow on the left hand side.