- Insights
- Staff Retention Report
Staff Retention Report
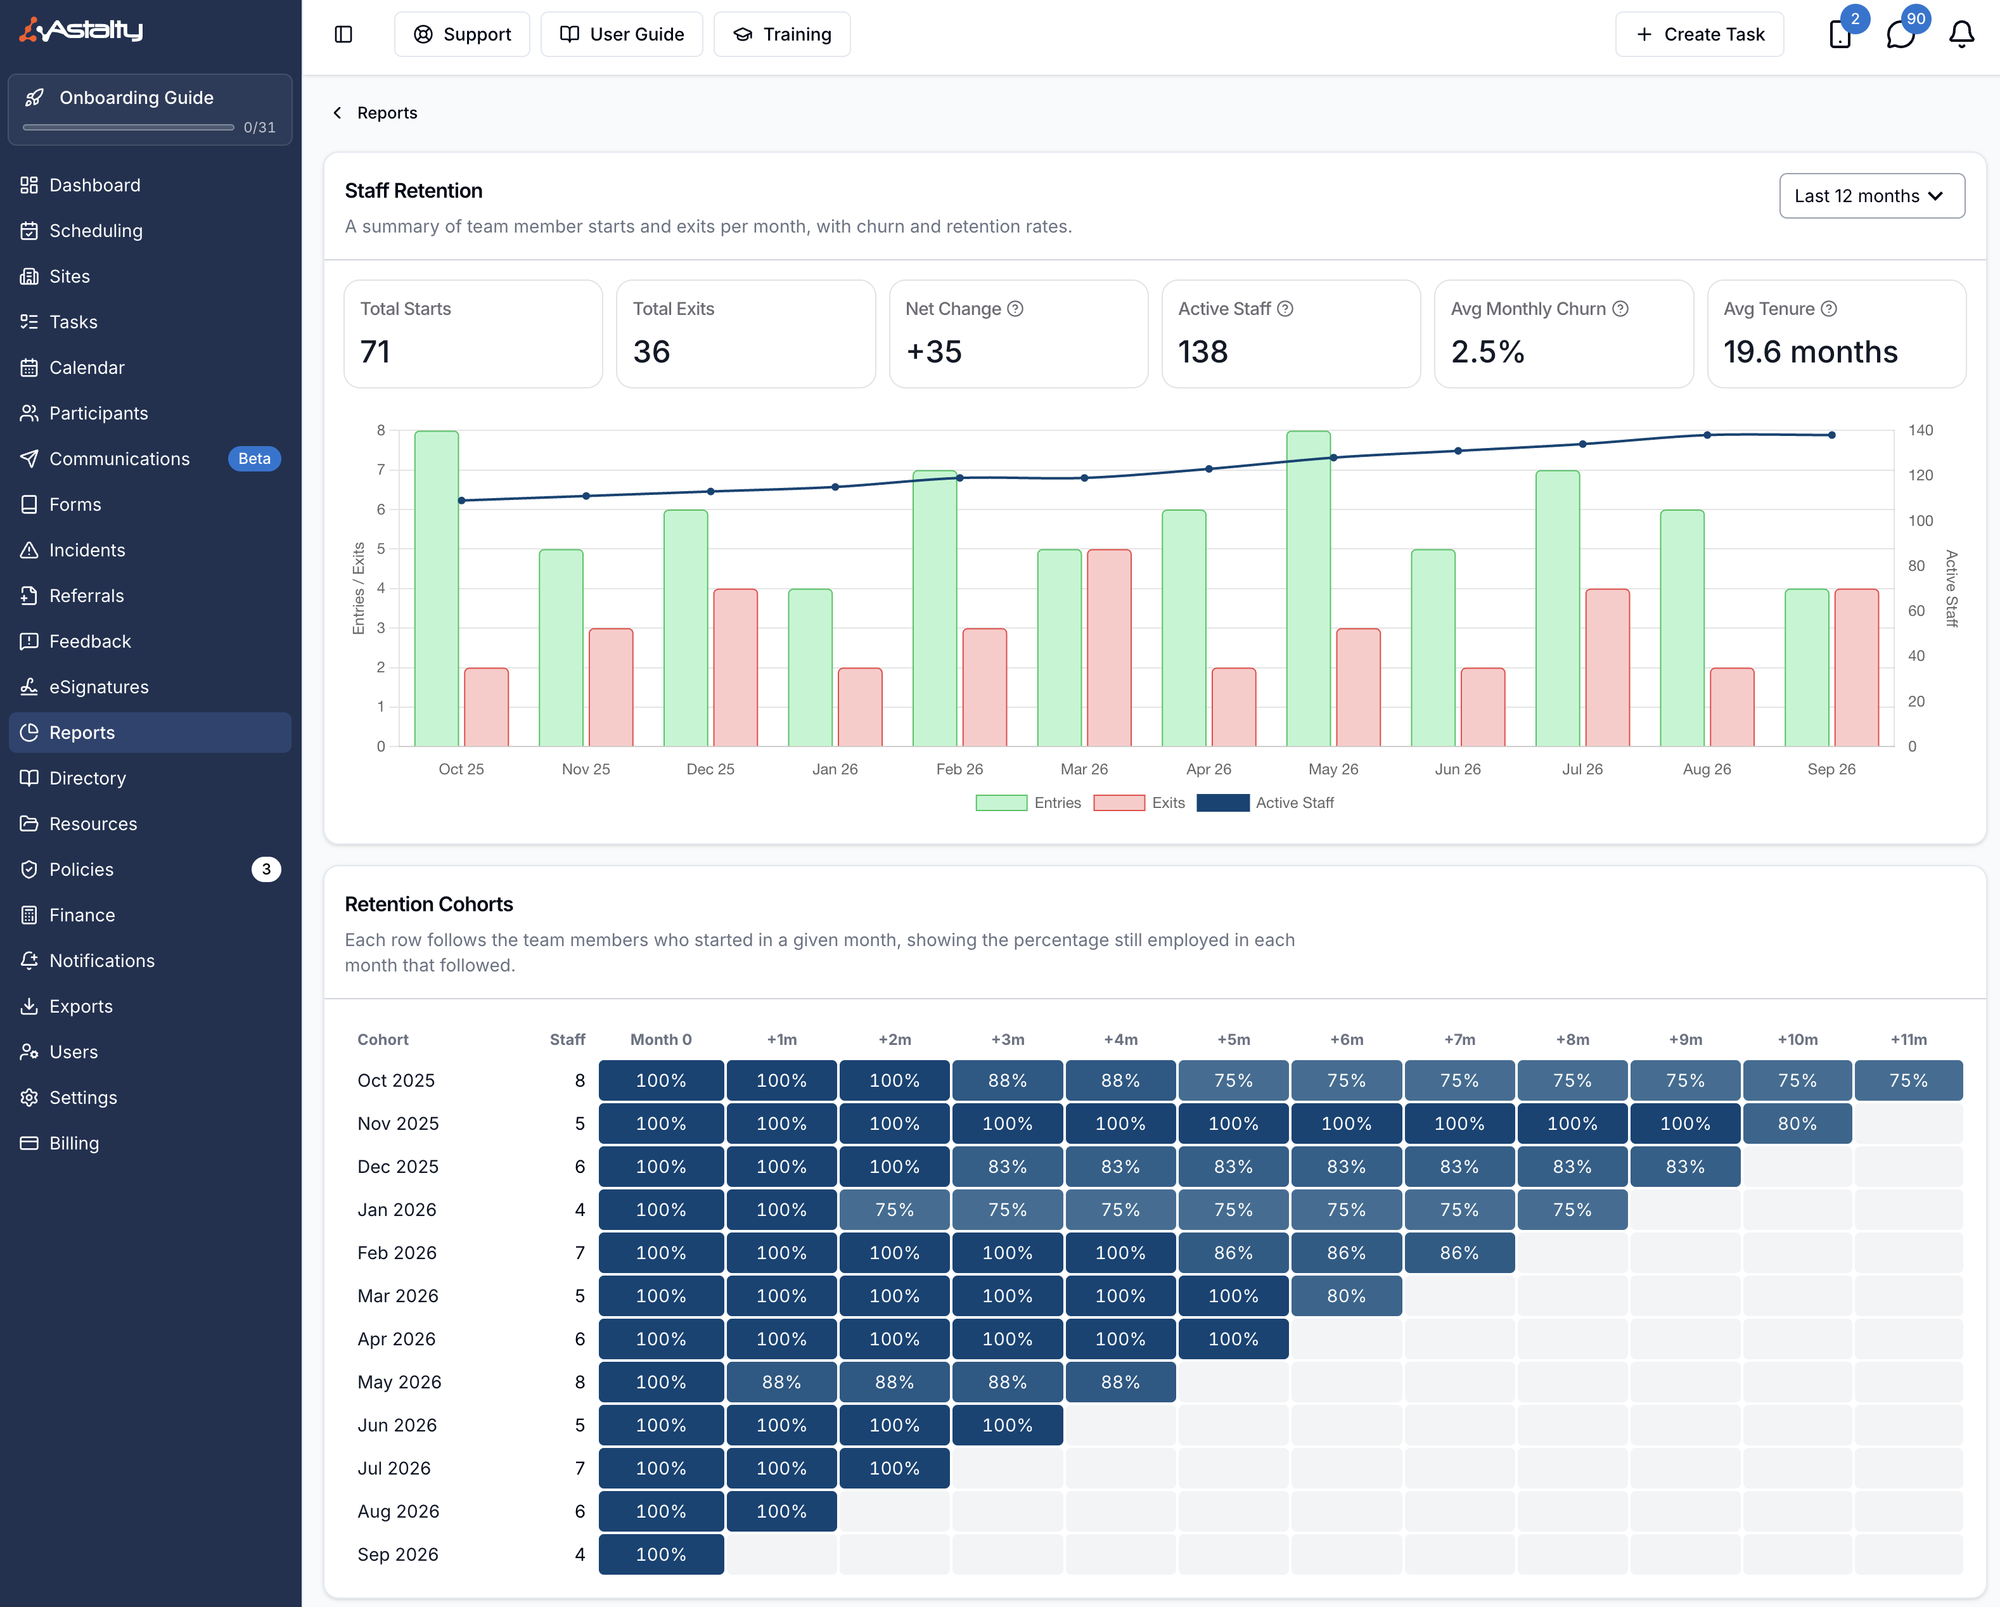
The Staff Retention Report summarises how many team members started and how many left, month by month, along with your churn and retention rates, average tenure and the reasons people gave for leaving.
It's available to Admins and Managers. The Participant equivalent is the Participant Retention Report.
Where to Find It
- From the left-hand menu, select Reports.
- Under Team, select Staff Retention.
Use the selector in the top right to choose the reporting window: Last 12 months, Last 24 months or Last 36 months. It opens on the last 12 months.
An exit is only counted once the user is deactivated — see Restricting, Deactivating and Reactivating Users. An employment end date on someone still active, such as a fixed-term contract end date, doesn't count as churn.
Three groups are left out of every figure: Auditors, users still on an invitation who have no employment start date, and deleted users.
The Summary Figures
Six figures sit across the top, covering the whole selected window:
| Figure | What it means |
|---|---|
| Total Starts | Team members who started during the period |
| Total Exits | Team members who left during the period |
| Net Change | Starts minus exits across the period |
| Active Staff | Team members active at the end of the period |
| Avg Monthly Churn | The average of each month's exits as a proportion of the team members active at the start of that month |
| Avg Tenure | Average time between starting and leaving, for team members who left during the period |
Average tenure is shown in days below two months, and in months above that.
The Chart
Below the figures, a chart plots each month's starts — labelled Entries in the chart legend — and exits as bars, with Active Staff as a line across the top, so you can see whether headcount is moving because of hiring or because of departures.
Retention Cohorts
The Retention Cohorts table follows each intake as a group. Each row is the team members who started in a given month, and each column shows the percentage of that group still employed in the months that followed.
Reading across a row tells you how long a particular intake stayed. Reading down a column compares intakes at the same age — which is how you spot whether retention is improving over time.
Exit Reasons
The Exit Reasons table counts the exits in the period by the reason chosen when each team member was deactivated, highest count first. Exits with no reason recorded are grouped under Not recorded.
Reasons come from the list at Settings → Users — see Users Settings. The reason and any exit details are captured on the deactivation screen, and can be corrected afterwards from the user's profile.
Monthly Breakdown
The final table gives the underlying numbers per month:
| Column | What it shows |
|---|---|
| Month | The month being reported |
| Starts | Team members who started that month |
| Exits | Team members who left that month |
| Active at Start | Team members active at the start of the month |
| Active at End | Team members active at the end of the month |
| Net Change | Starts minus exits for that month |
| Churn Rate | Exits as a proportion of the team members active at the start of the month |
| Retention Rate | The proportion of team members active at the start of the month who were still active at the end |
Starts, Exits, Net Change, Churn Rate and Retention Rate can each be sorted.
Dashes mean different things by column:
- Starts, Exits and Net Change show a dash in place of zero — so a dash there means none that month.
- Churn Rate and Retention Rate show a dash when there is no rate to calculate, which happens when no team members were active at the start of the month.
Things to Keep in Mind
- Rates are shown to one decimal place.
- A user deactivated without an employment end date is counted as leaving on the date they were deactivated.
- The report covers everyone in your account — it isn't filtered to a team, site or region.