Dashboard Widget Builder
Use the Dashboard Widget Builder to assemble a dashboard from individual widgets - small panels covering revenue, team hours, tasks, incidents and more - and choose exactly who sees it. Build a dashboard for your organisation generally, or build a Participant dashboard that your team sees on Participant profiles.
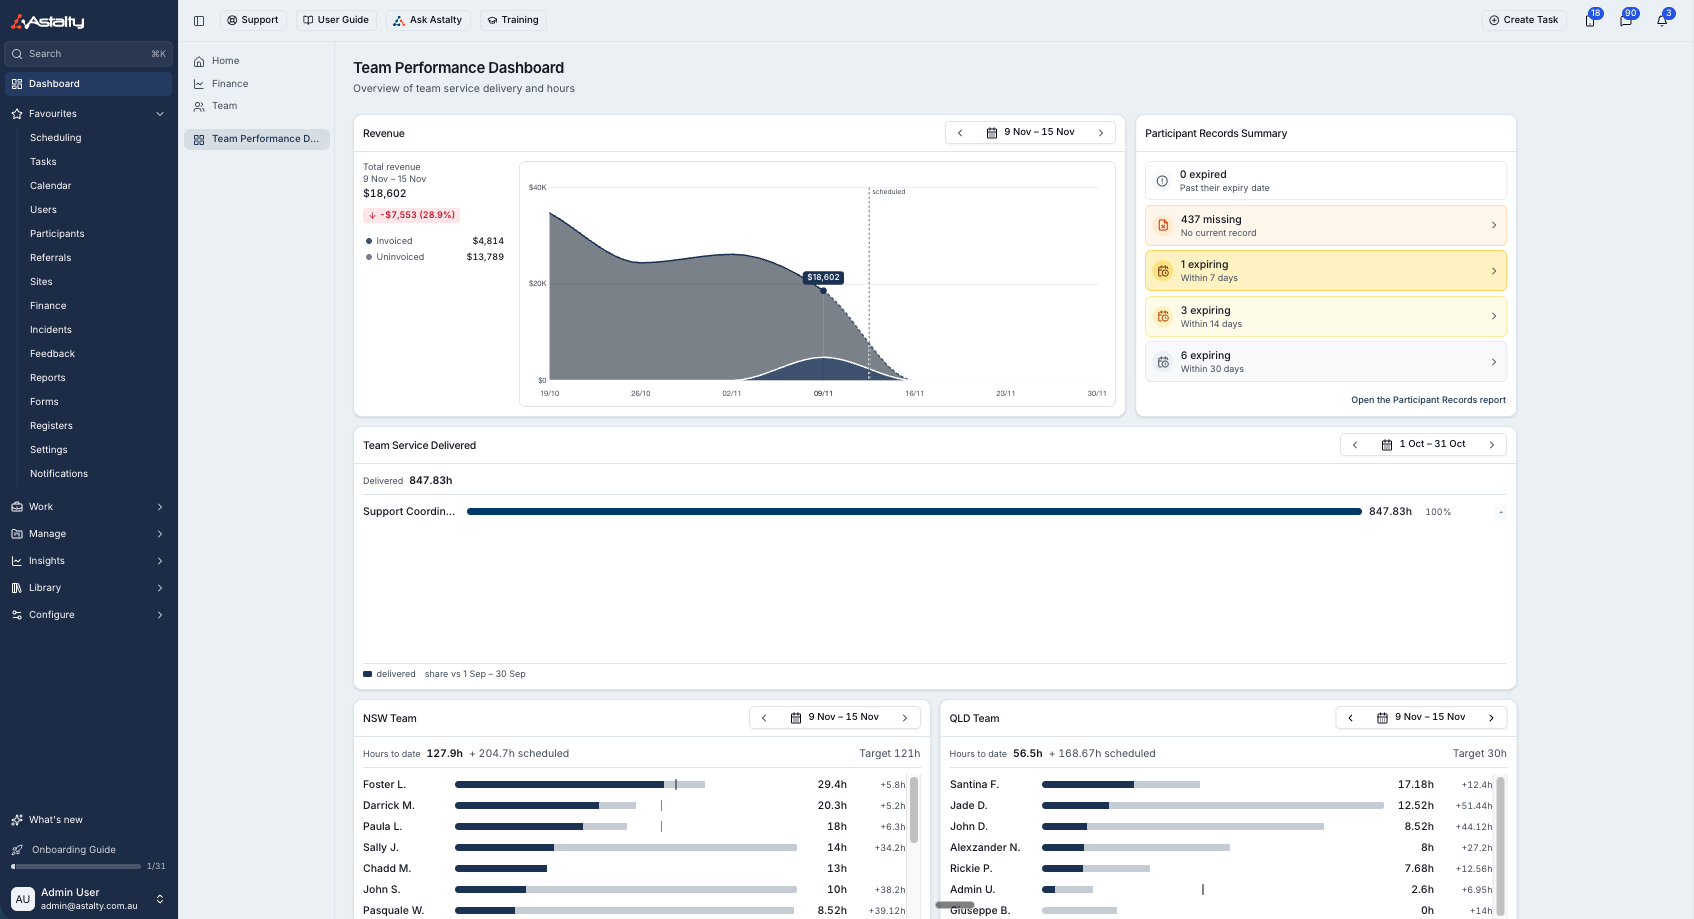
This is separate from the built-in Dashboard views (Home, Finance and Team), which every Admin and Manager already has and which aren't built with the Widget Builder.
Who Builds and Shares Dashboards
Only Admins can create a dashboard. A dashboard isn't personal or self-service: an Admin builds it once, then shares it with an Audience of specific users, teams or user groups. A dashboard with no audience doesn't appear under Dashboard for anyone, including the Admin who created it, but Admins can still find and edit it in Settings > Dashboards.
Someone you've shared a dashboard with finds it under Dashboard in the left-hand menu, listed by its own name alongside Home, Finance and Team if they can see those. If nobody has shared a dashboard with them yet, Dashboard shows No dashboards assigned.
Managing Dashboards from Settings
Admins manage every dashboard built for the organisation - not just their own - from Settings.
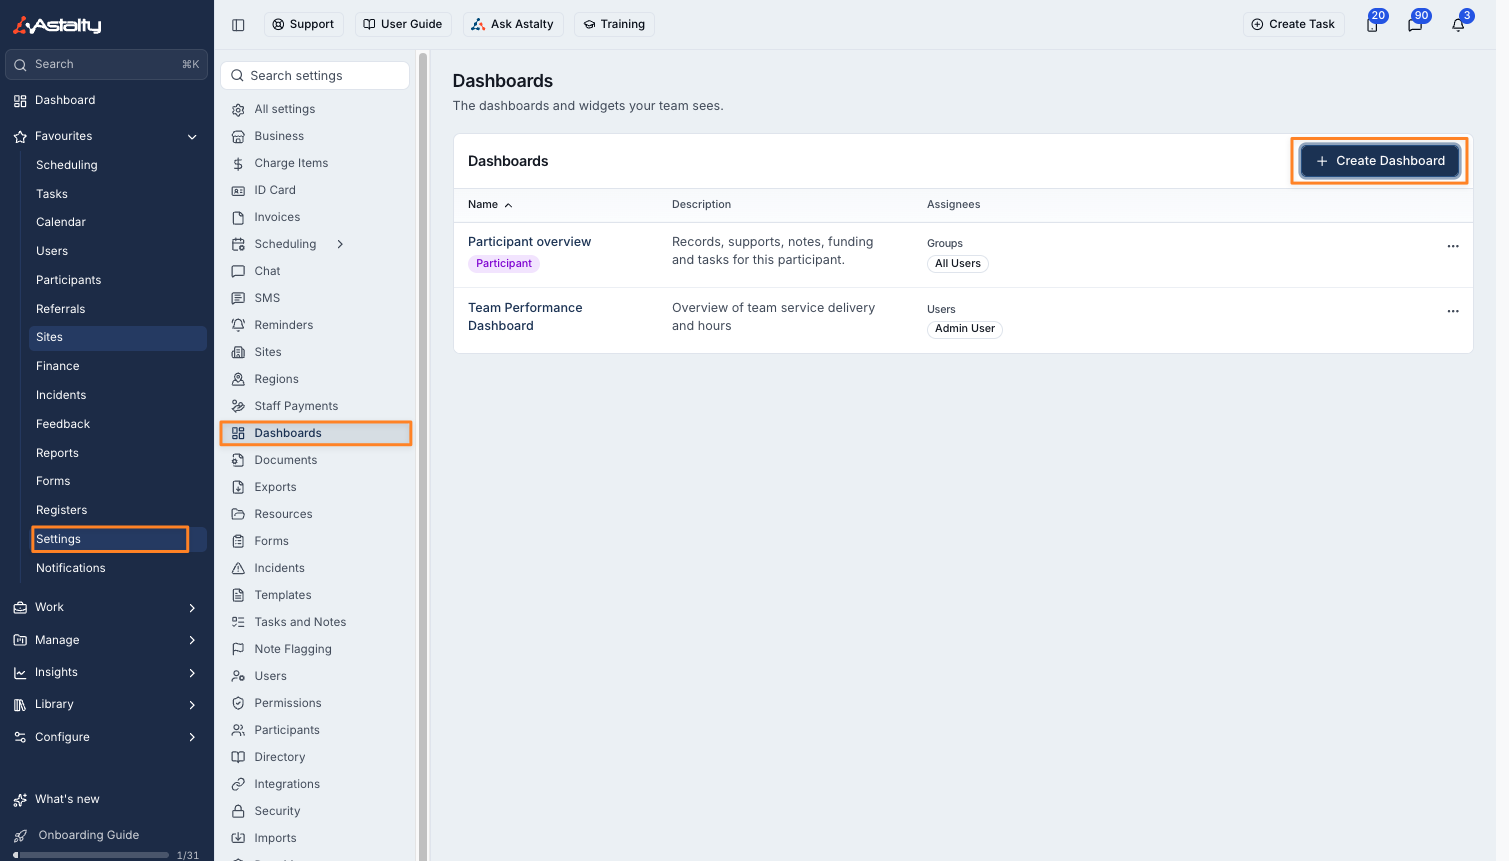
- Open Settings > Dashboards.
- The Dashboards table lists every dashboard, its description and its Assignees - who it's shared with.
Creating a Dashboard
- From Settings > Dashboards, select Create Dashboard.
- If Astalty asks What is this dashboard about?, choose Your organisation for totals across everyone you support, or A participant for a Participant dashboard.
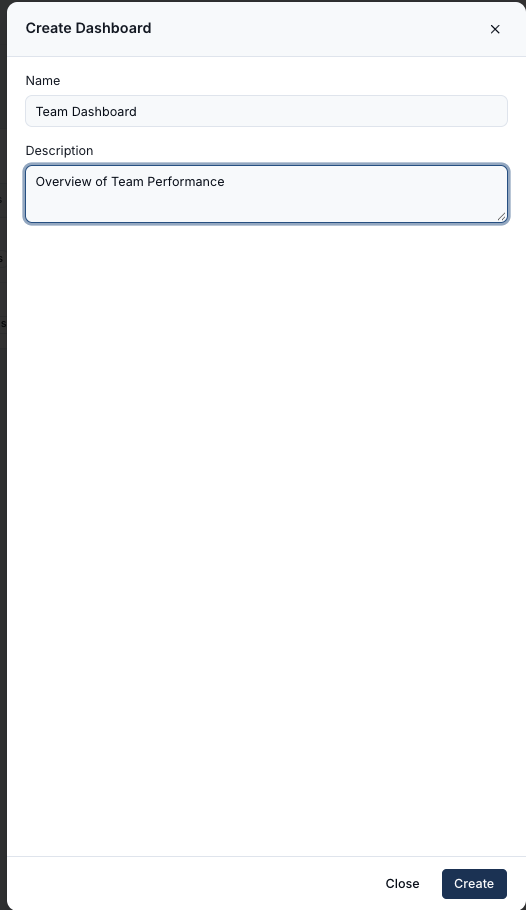
- Enter a Name and Description.
- Select Create.
Astalty opens the new dashboard ready for you to add widgets.
Adding Widgets
Select Widgets to open the widget palette, then Search widgets or browse by category. Select the + on a widget, or drag it onto the dashboard, to add it.
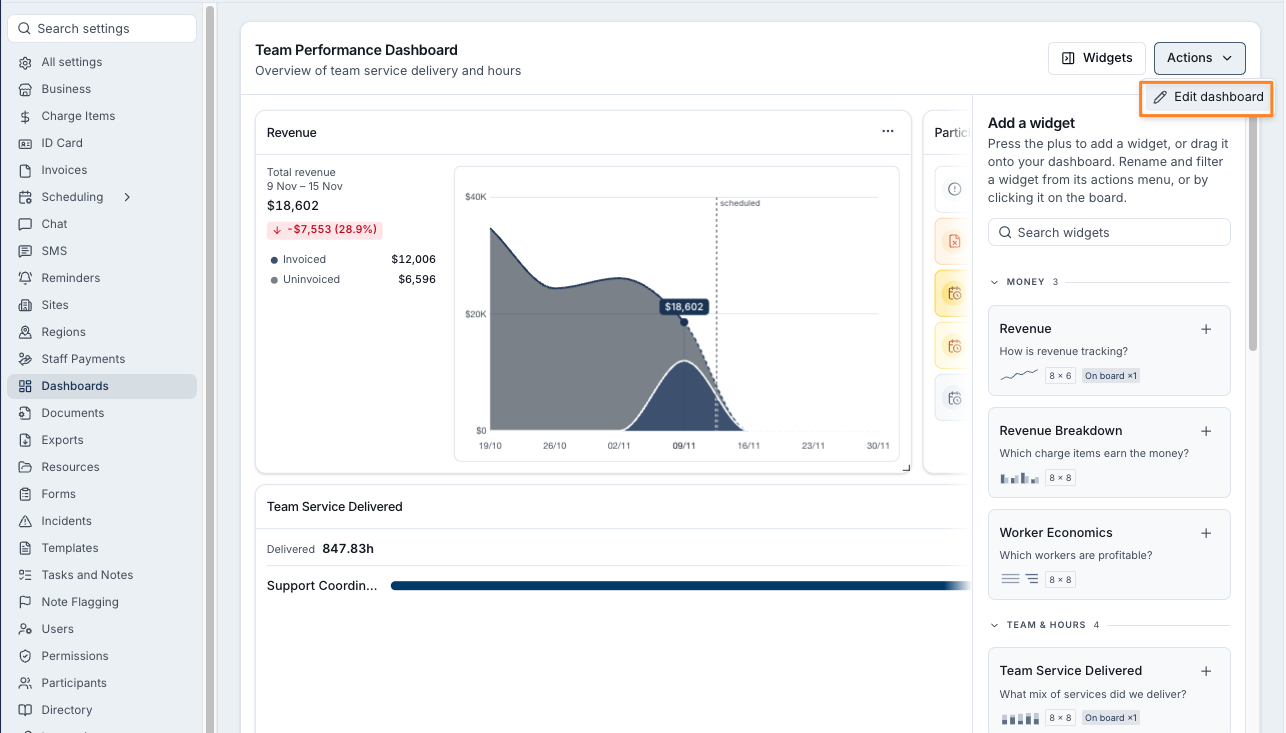
The palette groups widgets into Participants, Money, Team & hours, Tasks, Scheduling, Compliance and Incidents. Nineteen widgets are available for a dashboard shared with users, teams or user groups. Organisation Widgets shows each one with its settings.
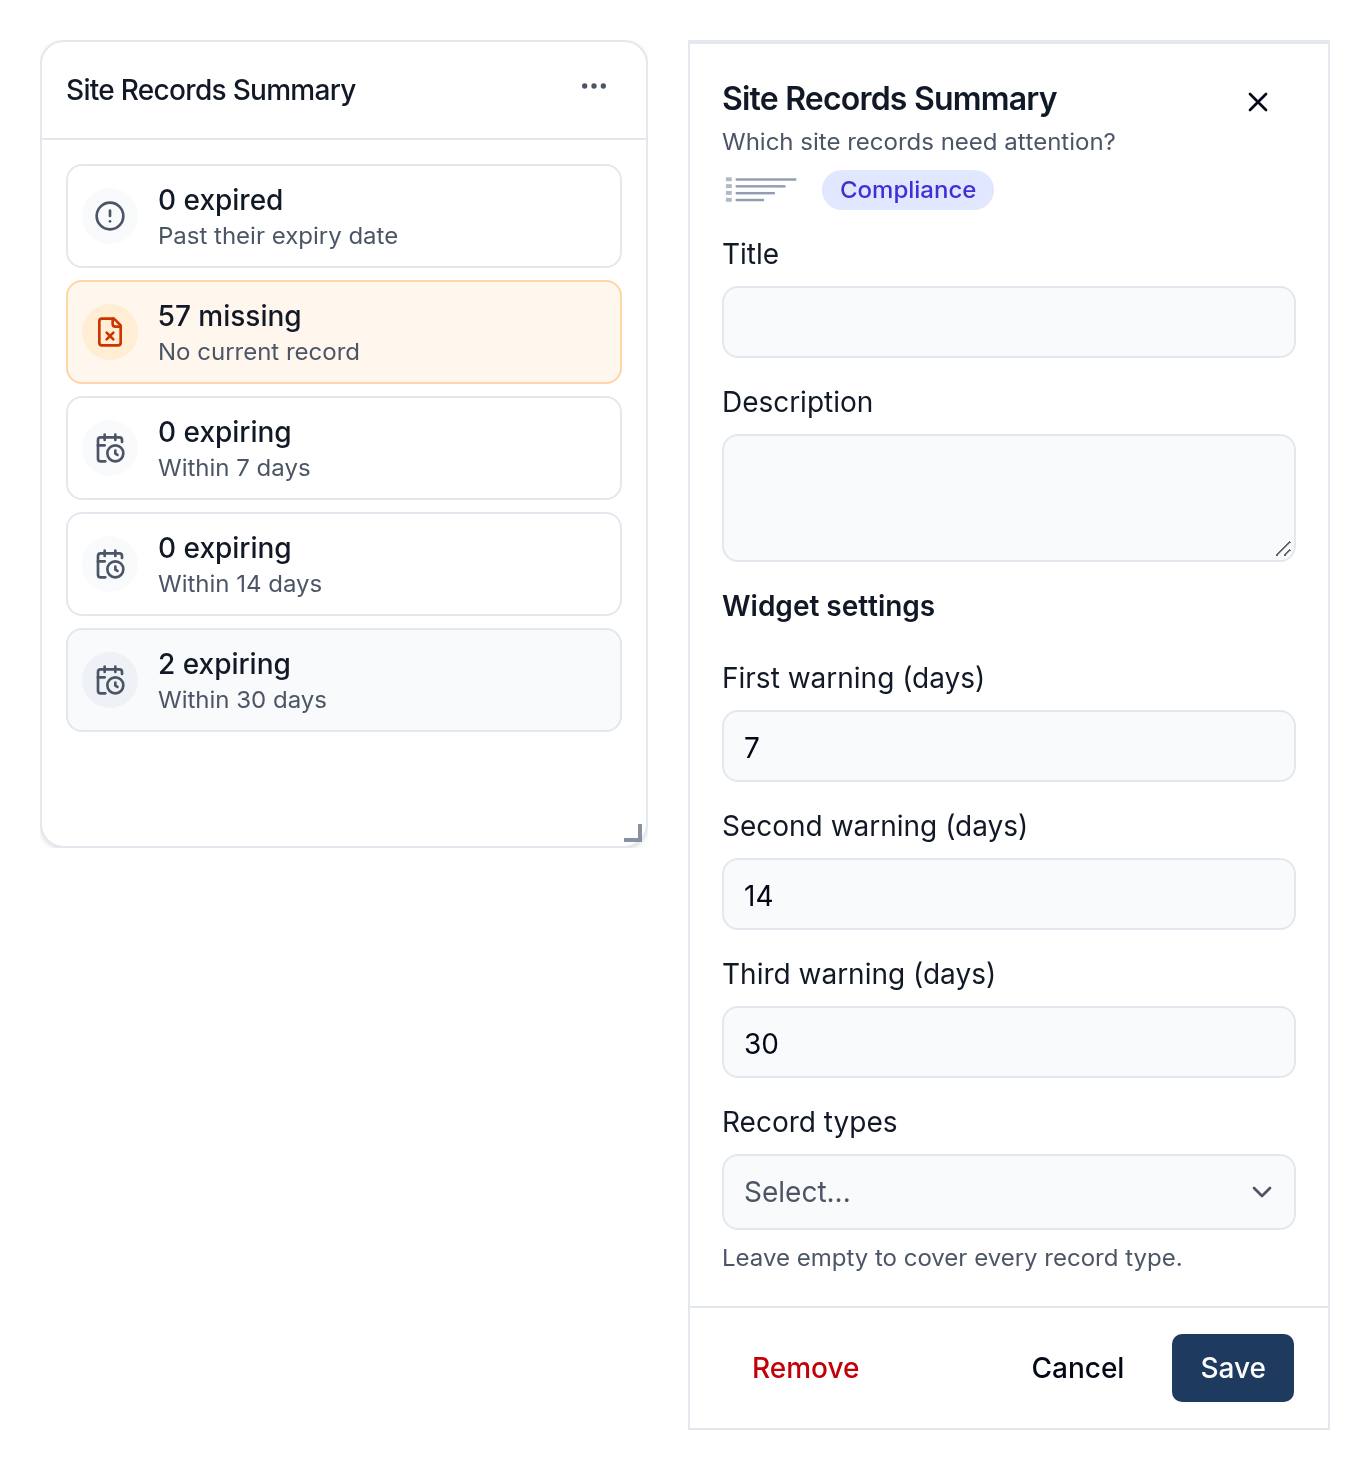
Some widgets only appear in the palette when the feature they draw from is enabled for your account - for example, Policy Acknowledgements needs Policies, and Site Records Summary needs Scheduling. See Optional Features if a widget you expect is missing.
Five more widgets are built for Per-Participant Dashboards and only appear there. Participant Dashboard Widgets shows each one with its settings.
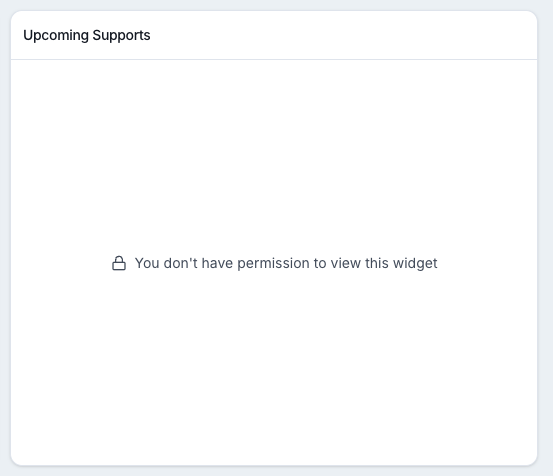
A widget already added to a dashboard can separately need its own viewing permission. Someone who can see the dashboard but lacks that permission sees "You don't have permission to view this widget" in place of its contents - for example, a Manager without Scheduling access viewing a dashboard's Upcoming Supports widget:
Configuring a Widget
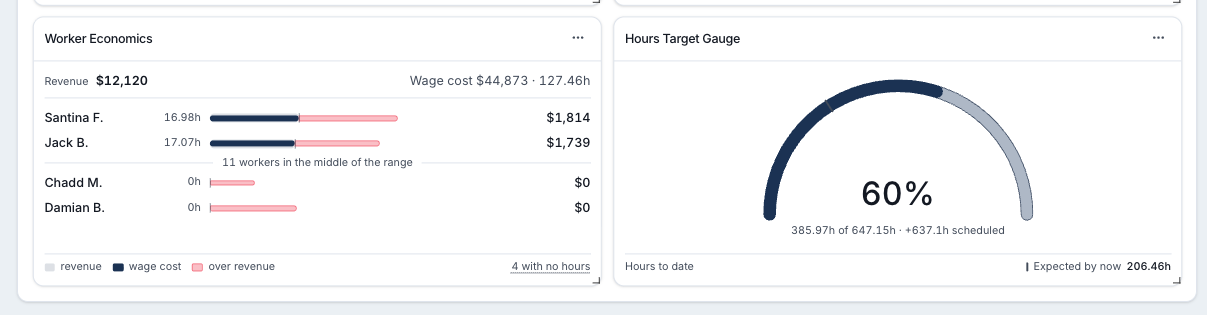
Select a widget on the dashboard to open its settings. Every widget has a Title and Description, plus its own Widget settings - these vary by widget type. Worker Economics, for example, lets you choose the Hours basis (Approved or Scheduled), the Default period, and which Finance metrics show:
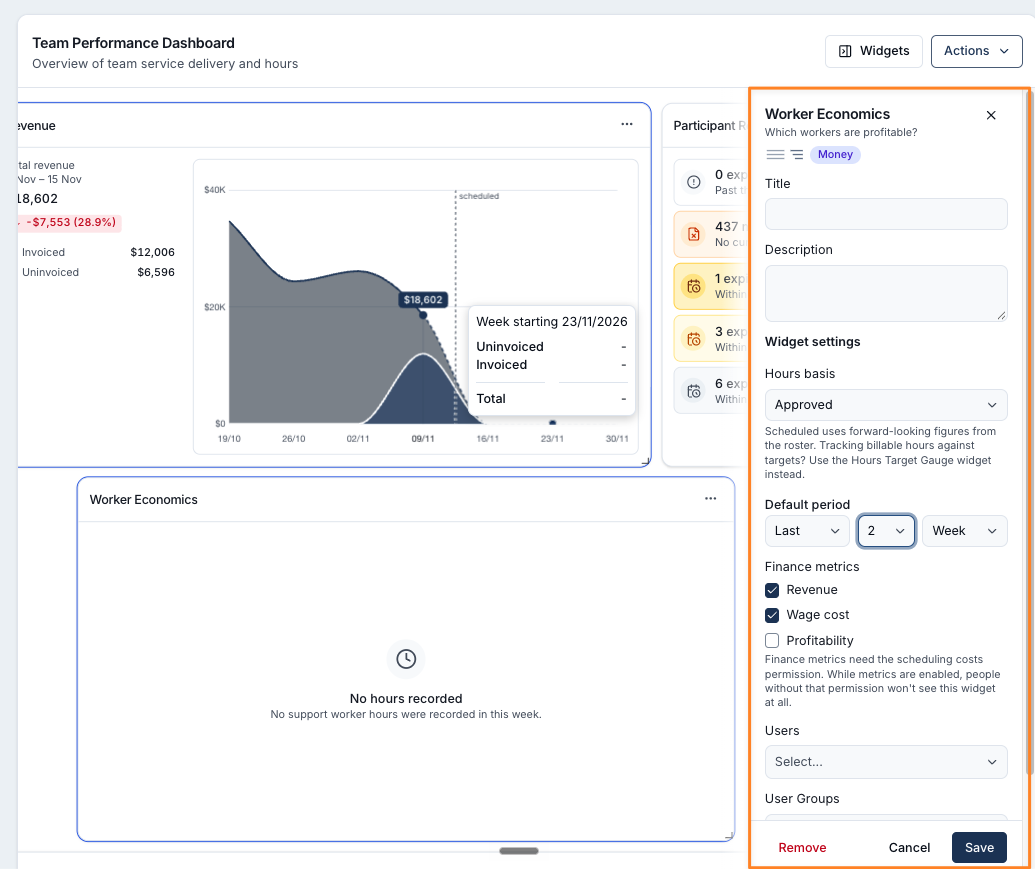
A widget showing navigation arrows, like Revenue, steps through periods without changing its settings. Hours Target Gauge's Default period instead pairs a period - such as This or Last - with a unit of Week, Month or Quarter:
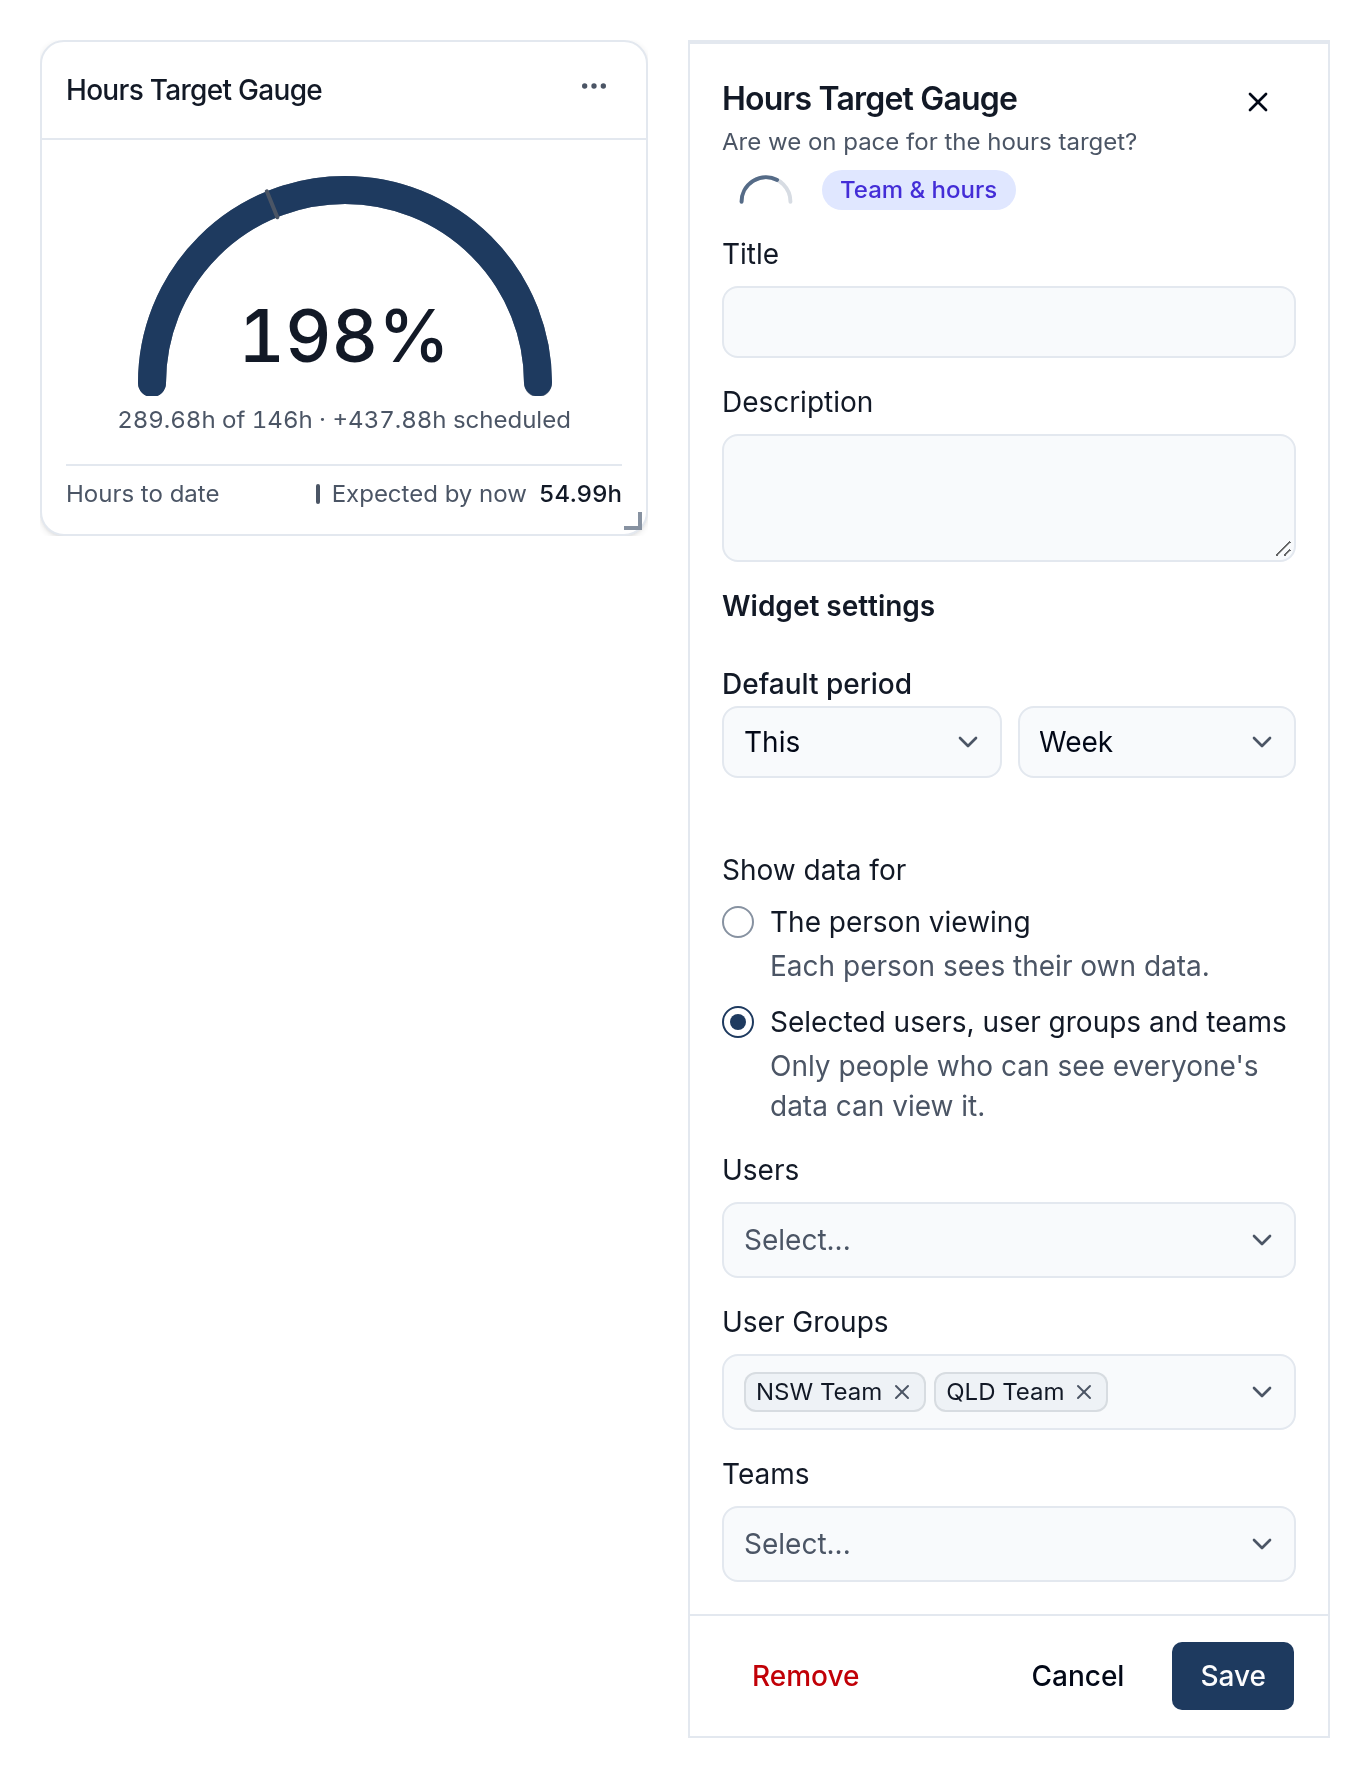
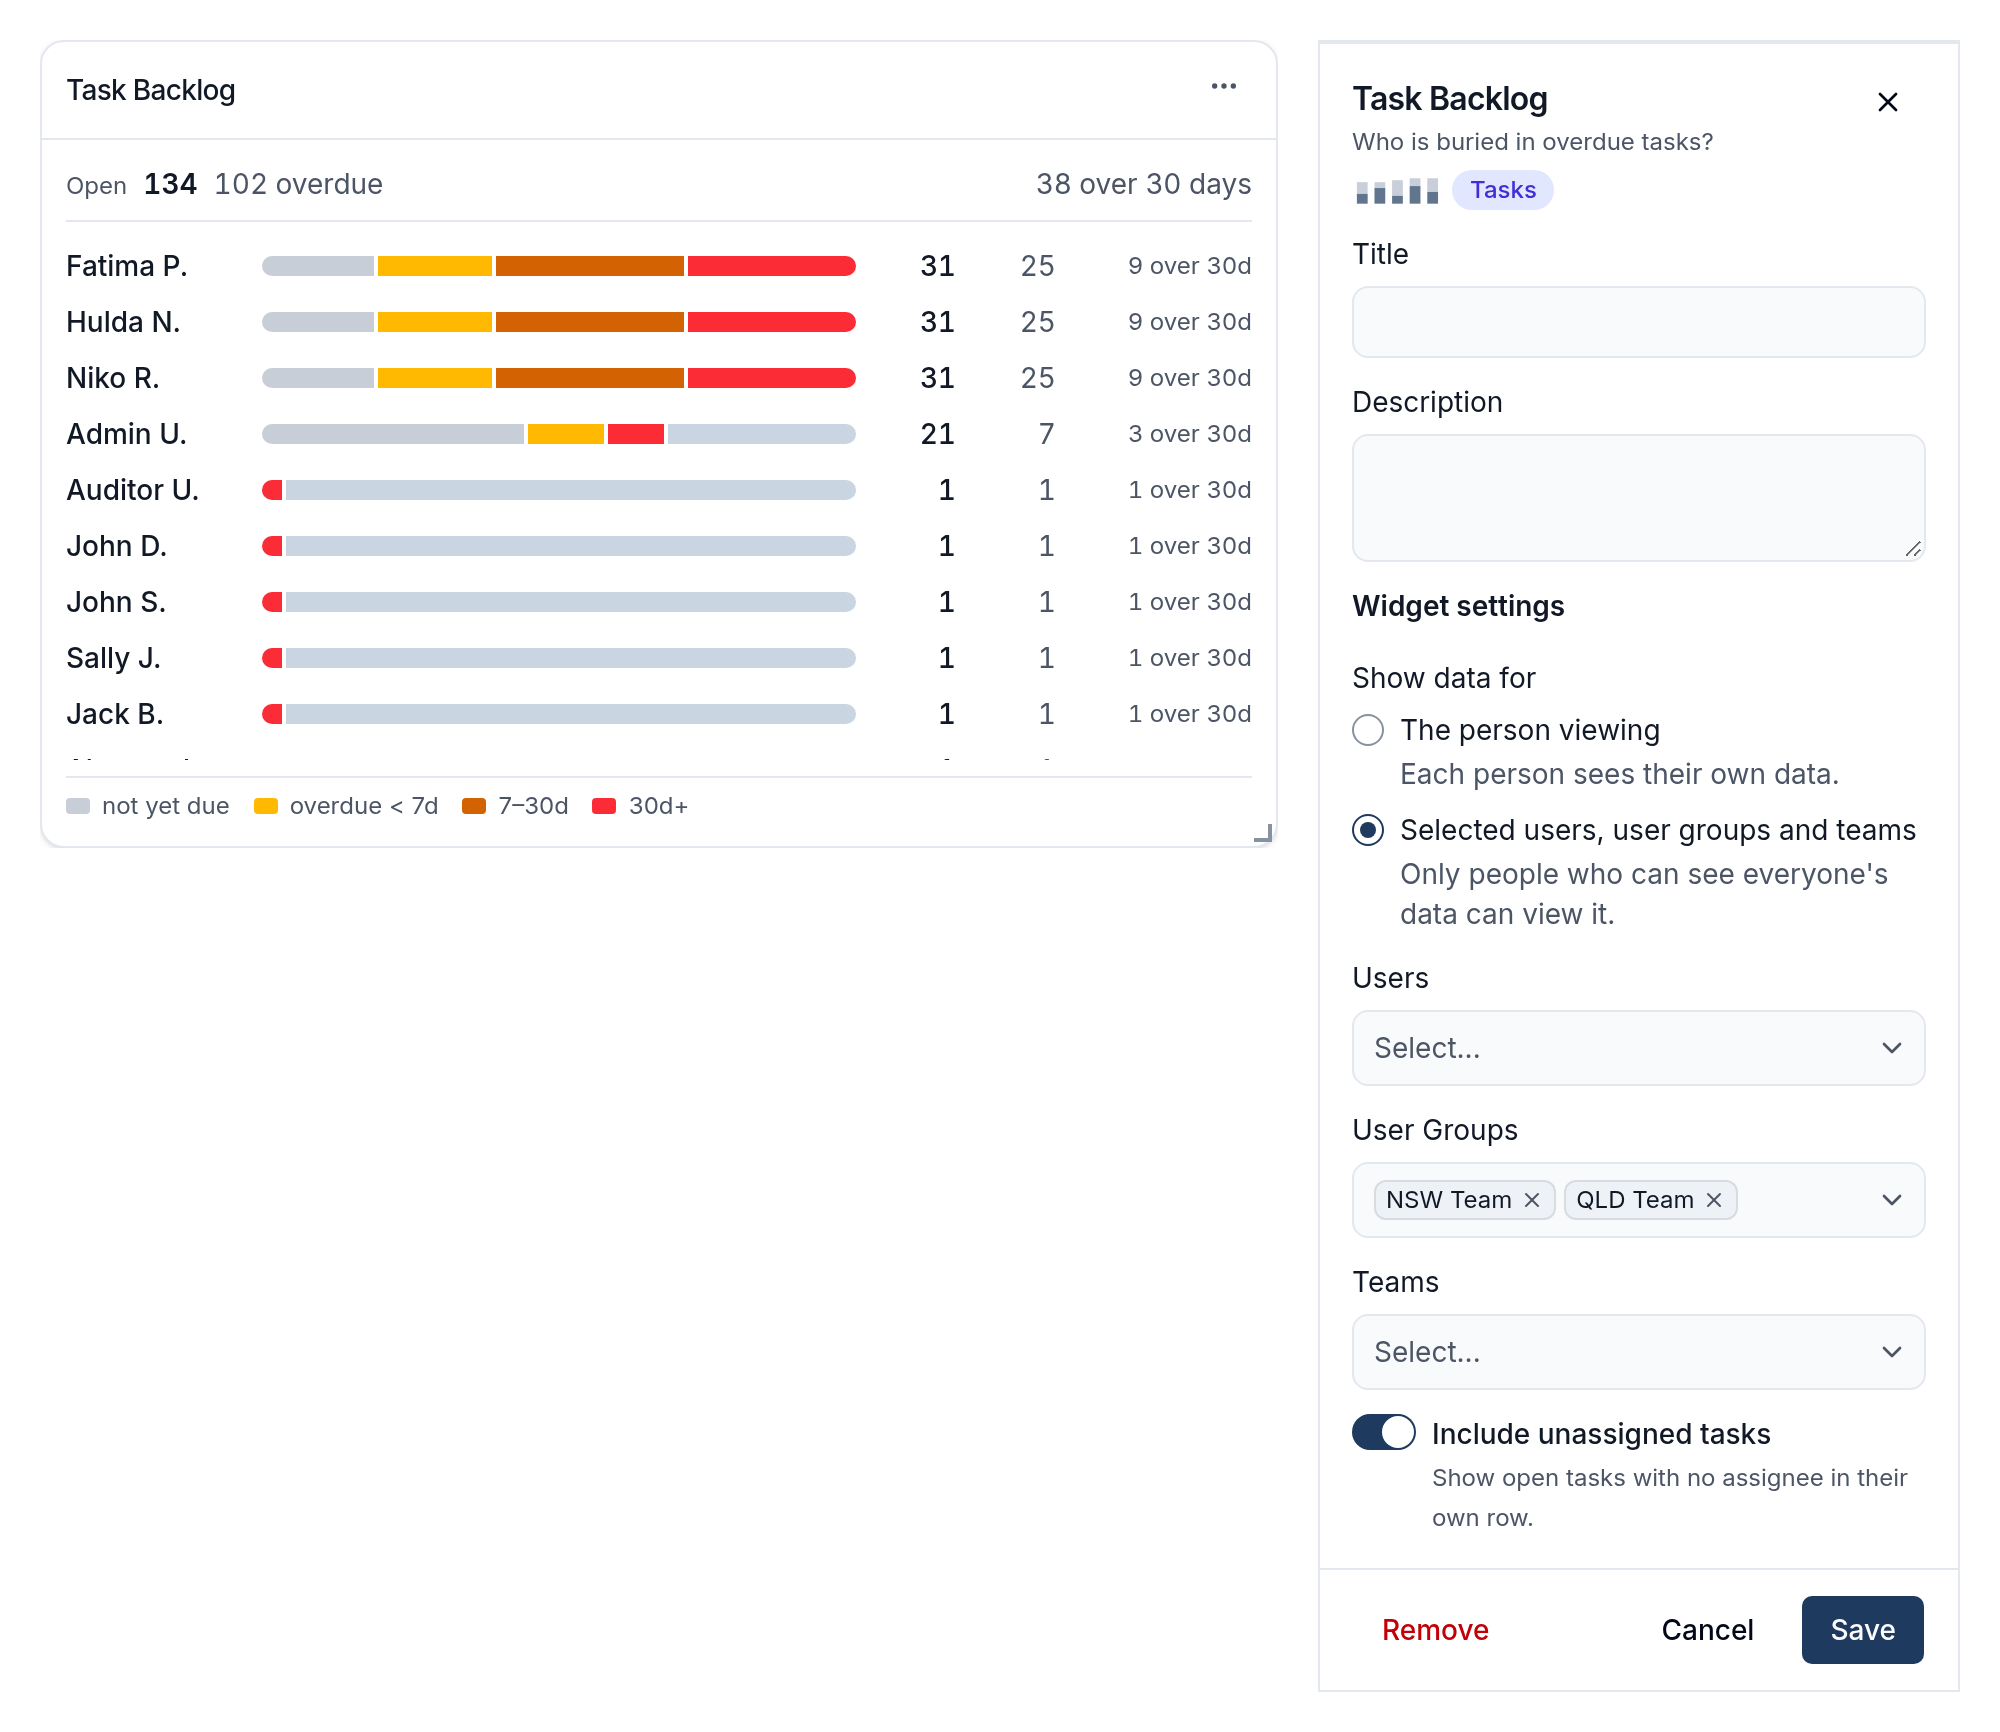
Several widgets - including Team Hours, Worker Economics and Task Backlog - also have their own Users, User Groups and Teams fields: these choose whose figures the widget counts, separate from who can see the dashboard. A widget that supports it instead offers Show data for, a choice between Selected users, user groups and teams and The person viewing - pick the second and the widget relabels itself (Task Backlog becomes My Tasks, for example) and shows only whoever is looking at the dashboard their own figures, with no list to maintain. Task Backlog also adds an Include unassigned tasks toggle, for open tasks with nobody assigned:
Select Save to keep your changes, or Remove to take the widget off the dashboard.
Arranging the Dashboard Layout
A widget's position and size on the board - its layout - is separate from its own settings above. Open the dashboard from Settings > Dashboards, then drag a widget by its header to move it, or drag its bottom-right corner to resize it on the 12-column grid. Astalty saves the new layout automatically.
Sharing a Dashboard
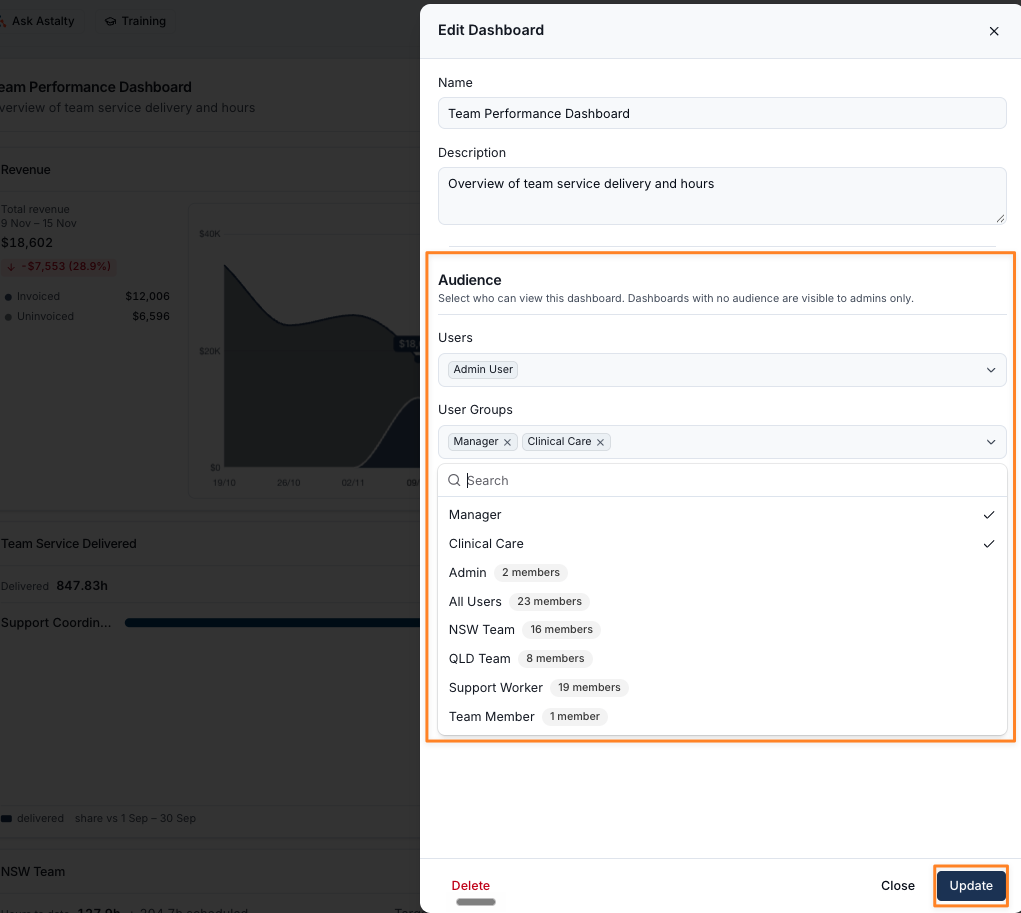
Open a dashboard from Settings > Dashboards and select Actions > Edit dashboard to change its Audience - who can view it. Add specific Users or User Groups, or select existing groups like Manager or All Users from the list. If you leave the audience empty, the dashboard is only listed in Settings > Dashboards, where Admins can manage it.
Per-Participant Dashboards
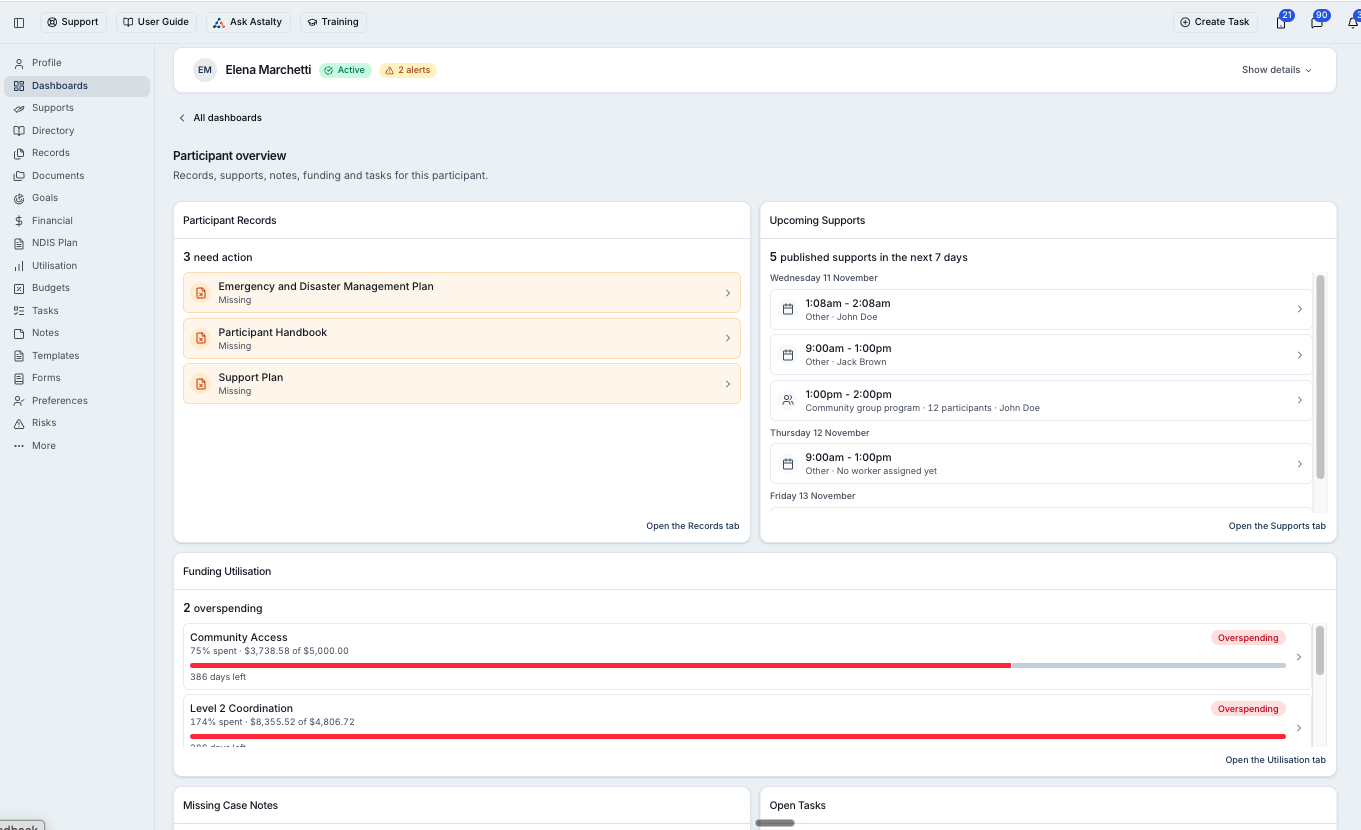
A Participant dashboard isn't shared with Participants themselves. It appears on Participant profiles, under a Dashboards tab, for the users, user groups and teams in its Audience. It's built from five widgets written specifically for one Participant's own records: Participant Records, Upcoming Supports, Funding Utilisation, Open Tasks and Missing Case Notes. Participant Dashboard Widgets describes each one and its settings.
While you're building a Participant dashboard and no specific Participant is selected, these widgets show example data:
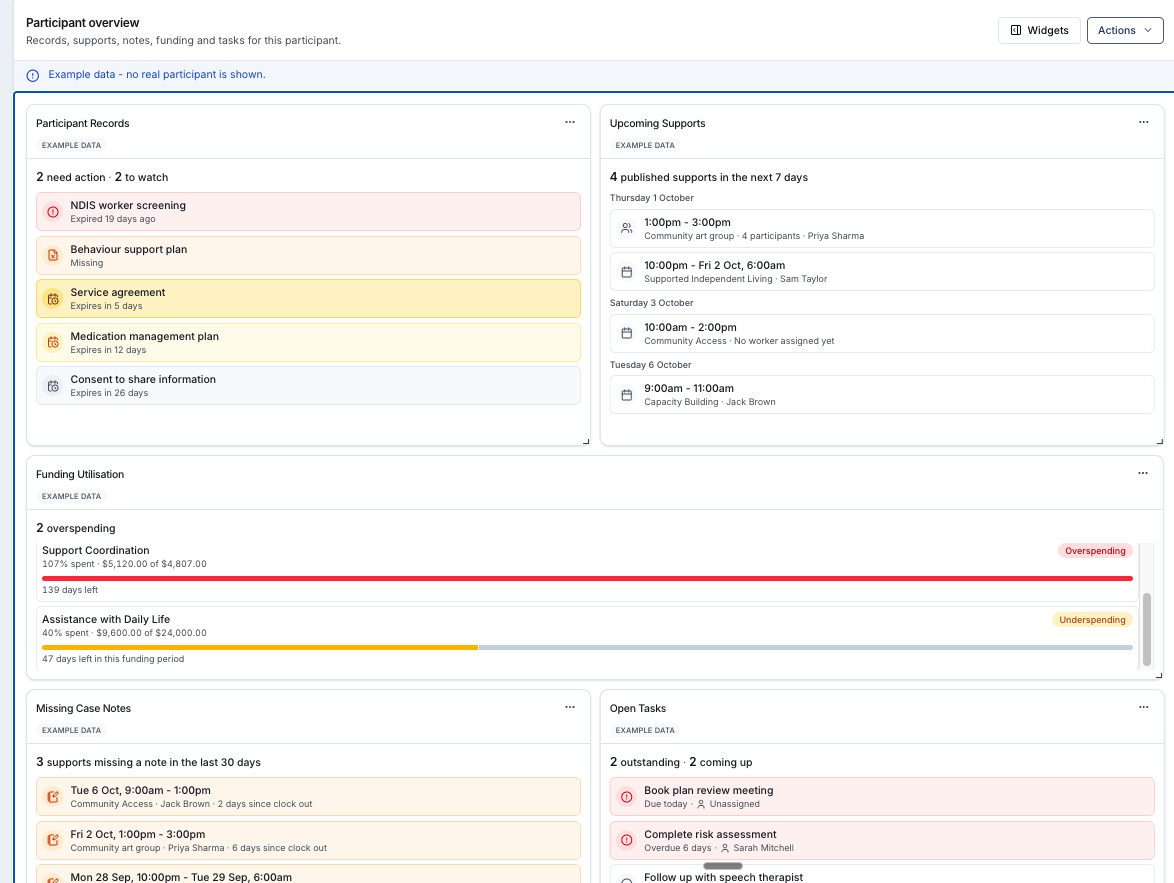
Once the dashboard is assigned and a Participant's profile opens it, each widget shows that Participant's real records, supports, funding and tasks:
Setting Up a Participant Dashboard
- From Settings > Dashboards, select Create Dashboard, choose A participant under What is this dashboard about?, enter a Name and Description, then select Create.
- Add widgets from the palette.
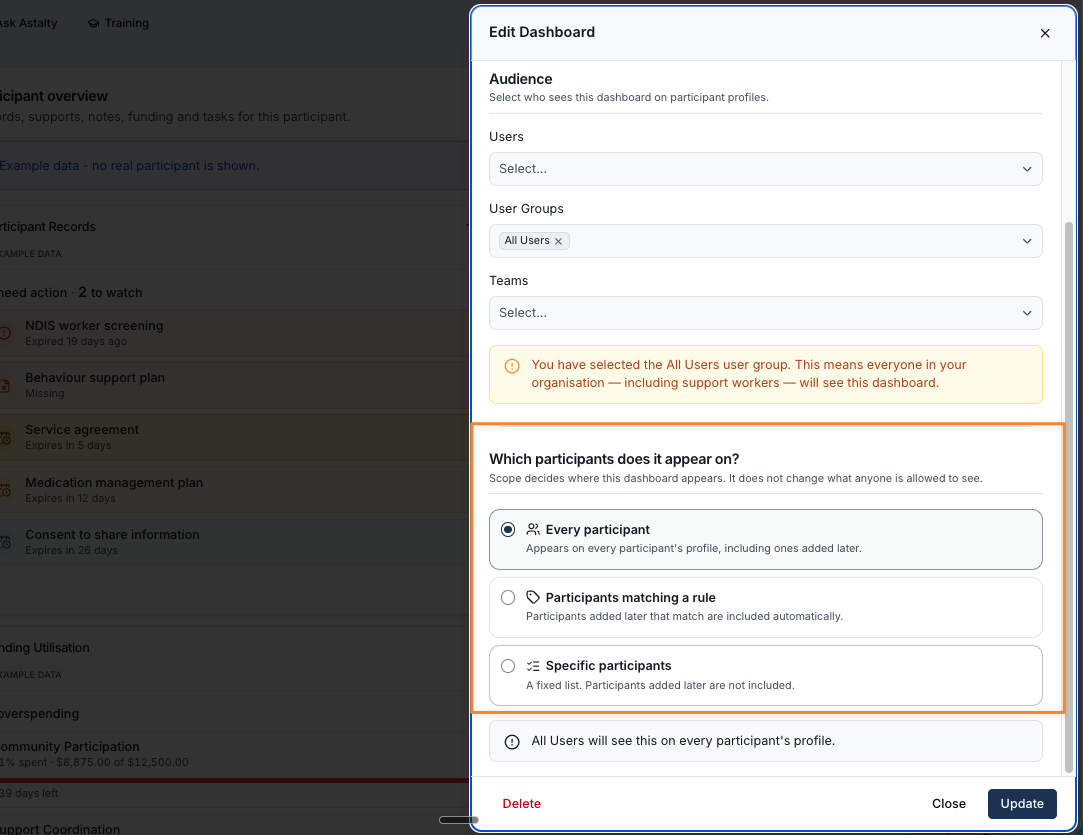
- Select Actions > Edit dashboard, then add the Users, User Groups or Teams who should see it under Audience.
- Under Which participants does it appear on?, choose:
- Every participant - every profile, including Participants added later.
- Participants matching a rule - then choose the Tags to match. Participants tagged later are included automatically.
- Specific participants - then choose the Participants. This is a fixed list, so Participants added later aren't included.
- Select Update.
Which Participants you choose only decides where the dashboard appears. The Audience still decides who sees it there.
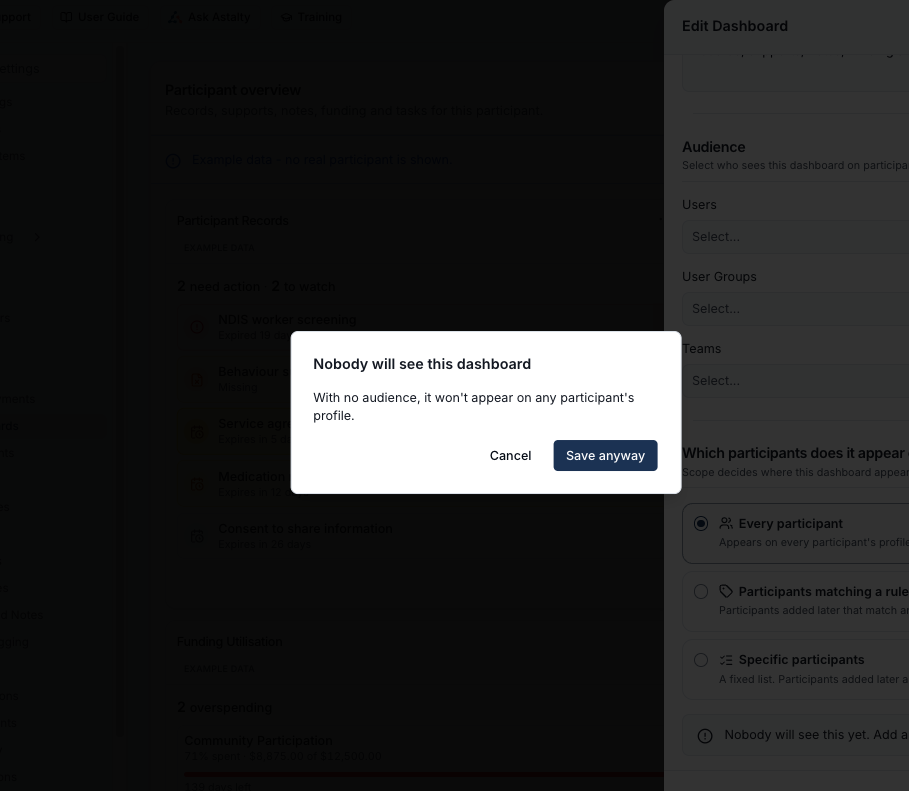
If you clear every name from a Participant dashboard's audience and save, Astalty asks you to confirm - Nobody will see this dashboard - because it won't appear on any Participant's profile. Select Save anyway to go ahead, or Cancel to keep the current audience.
Deleting a Dashboard
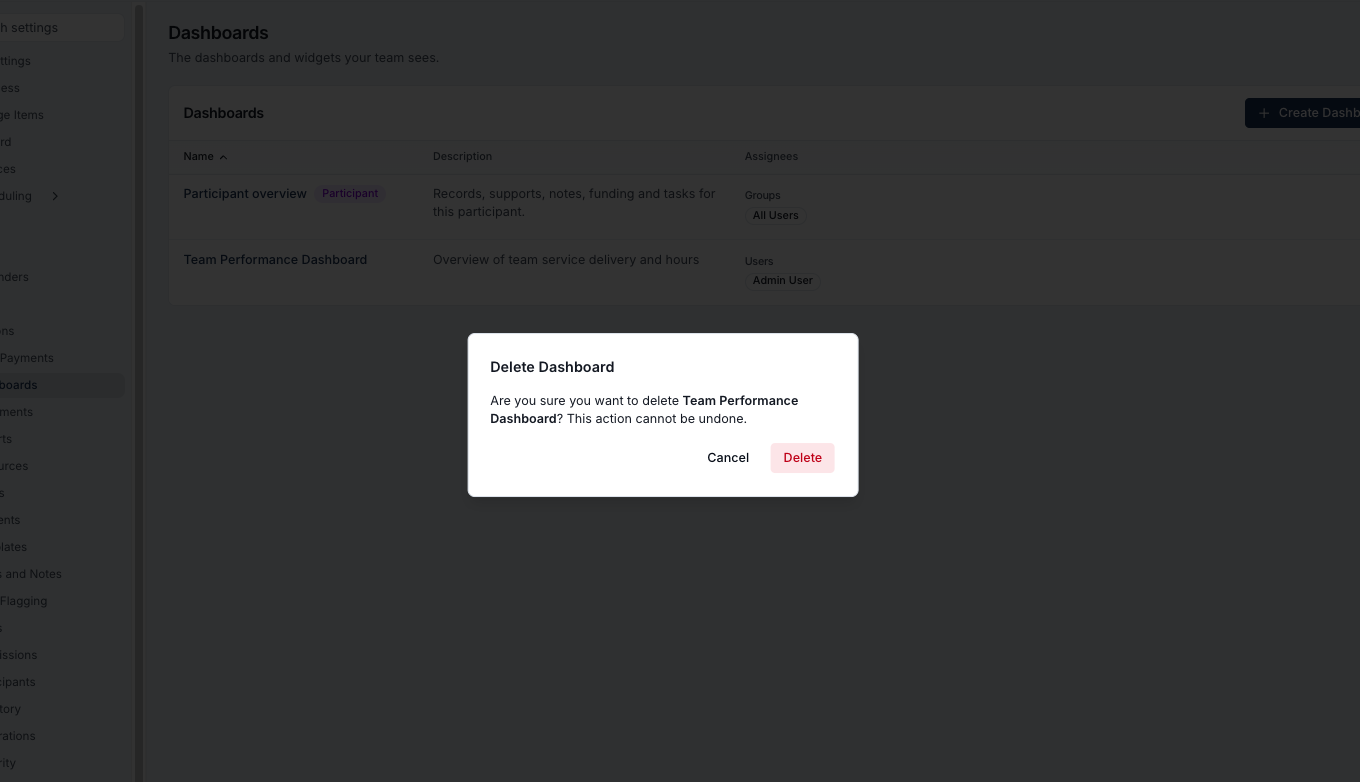
Deleting a dashboard is permanent. From its row's menu in Settings > Dashboards, or from Edit Dashboard, select Delete, then confirm. Astalty warns you first: "Are you sure you want to delete [dashboard name]? This action cannot be undone."
Current Limitations
- There's no way to duplicate or clone a dashboard - build each one from scratch.
- A dashboard can't be exported or printed.
- New accounts start with no default dashboard. Until an Admin builds and shares one, Dashboard shows an empty state for anyone with no built-in Home, Finance or Team access.
- The Dashboard Widget Builder is only available on the web app, not in the Astalty mobile app.
Organisation Widgets
Each widget below is shown on a dashboard beside its settings panel. Every widget also has a Title and Description, covered in Configuring a Widget, and a few settings recur across widgets:
- Default period sets the period a widget opens on: This or Last (with how many back), and Week, Month or Quarter. Viewers can still step through other periods on the widget itself.
- Show data for, Users, User Groups and Teams choose whose figures the widget counts, as Configuring a Widget explains.
- First warning (days), Second warning (days) and Third warning (days) set the three "expiring within" windows on a records widget, 7, 14 and 30 days by default. Record types limits the widget to the record types you choose; leave it empty to cover them all.
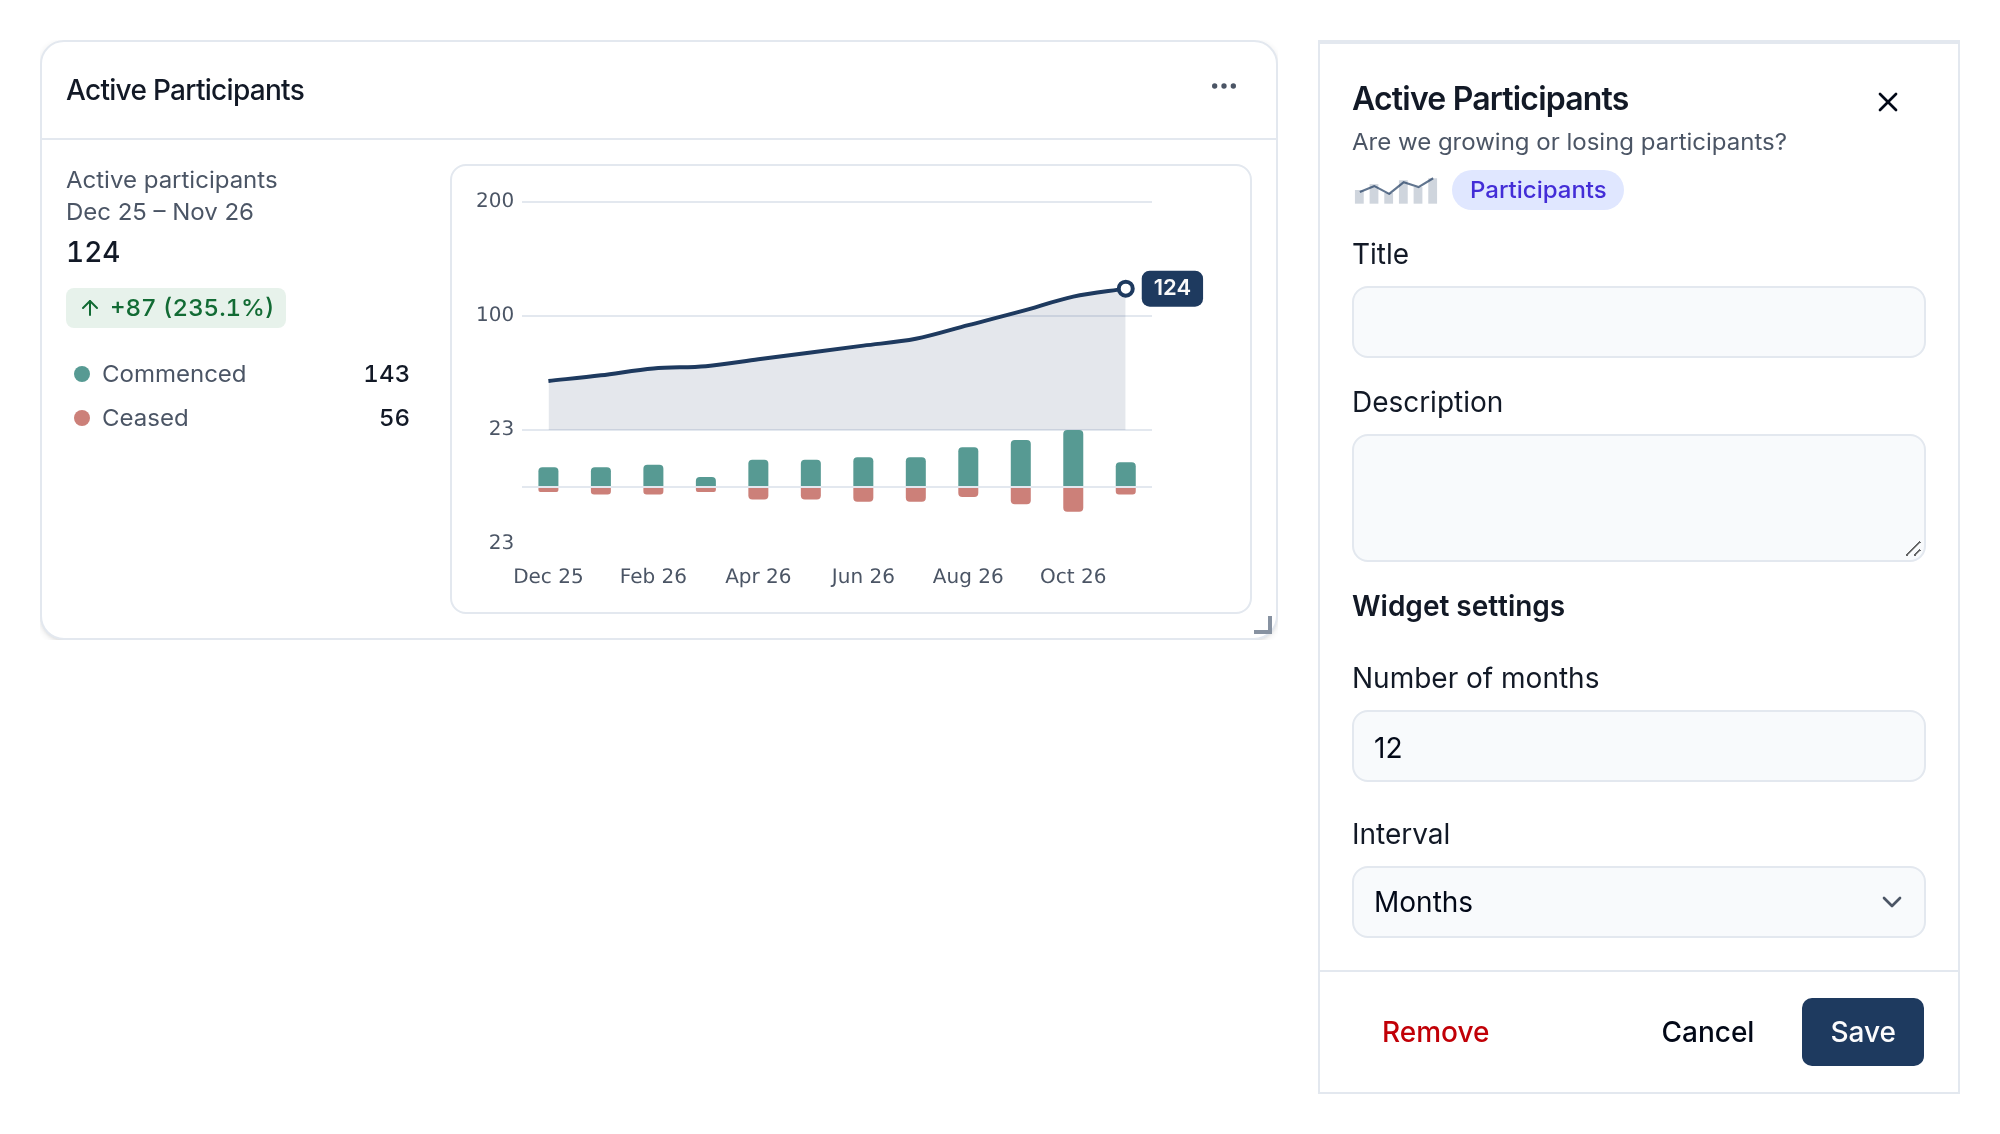
Active Participants
Shows your running total of active Participants, with the Participants who commenced and exited in each interval. Use it to see whether you're growing or losing Participants.
Choose the Interval - from Days to Years - and how many intervals to show. It opens on the last 12 months.
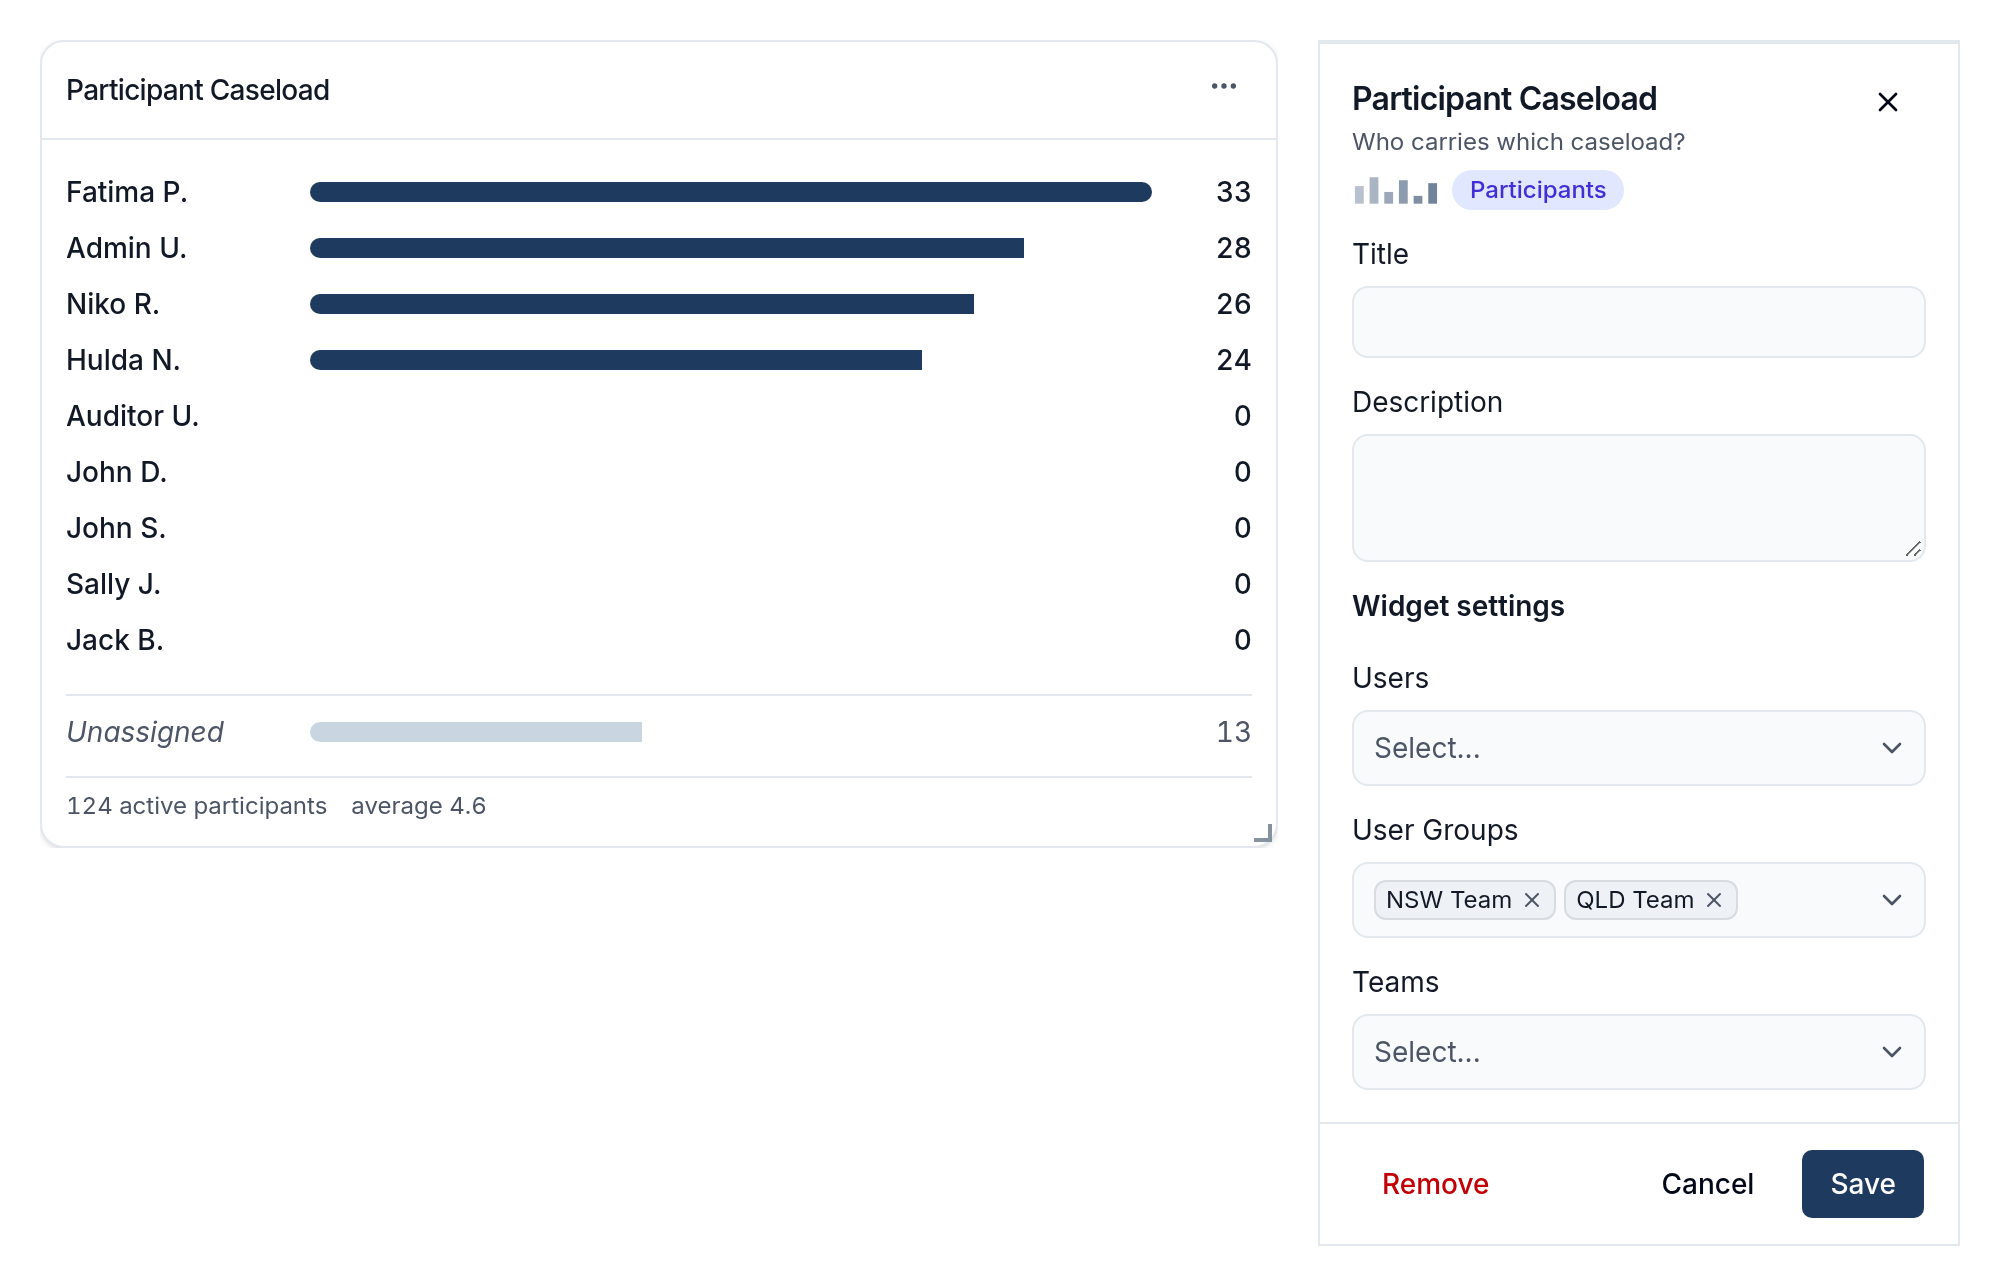
Participant Caseload
Shows how many active Participants each coordinator holds right now, with Participants who have no coordinator counted as Unassigned.
Choose the coordinators under Users, User Groups or Teams - each person you include gets their own row.
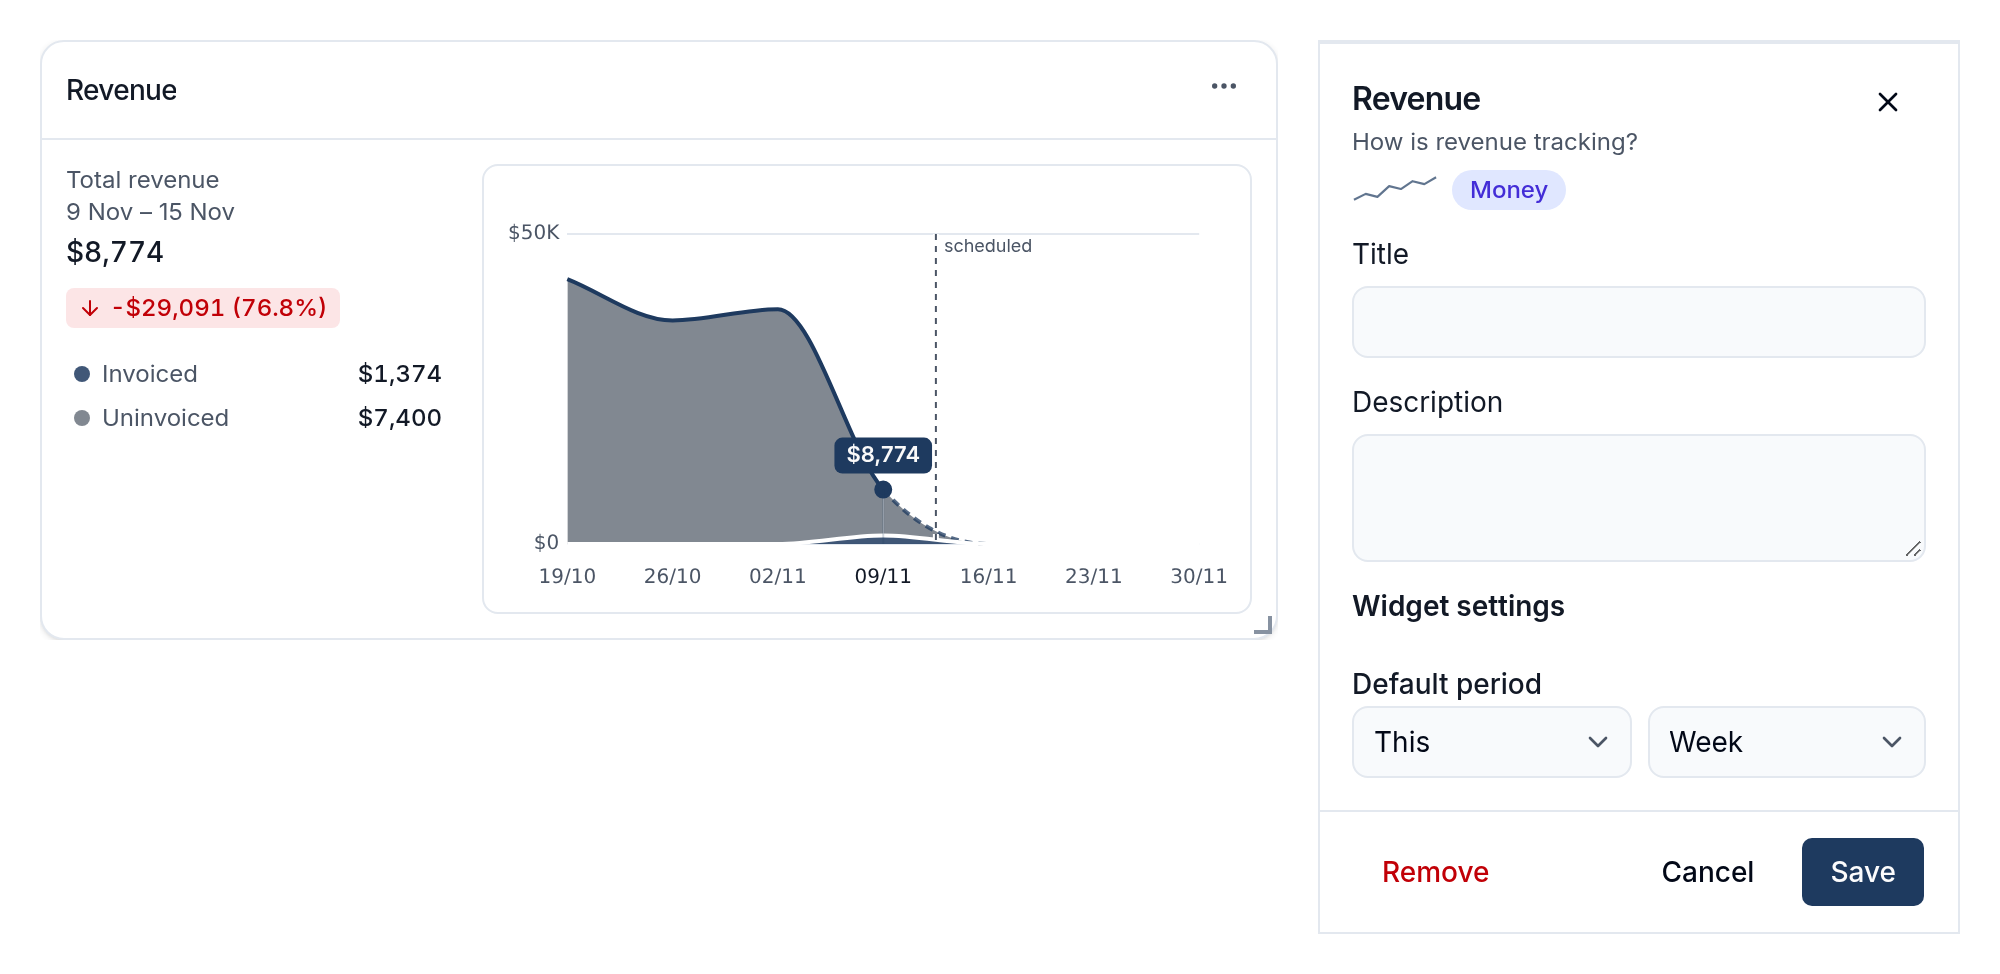
Revenue
Shows invoiced and uninvoiced revenue for the selected period, against the period before, on a chart of the periods around it.
Its only setting is the Default period.
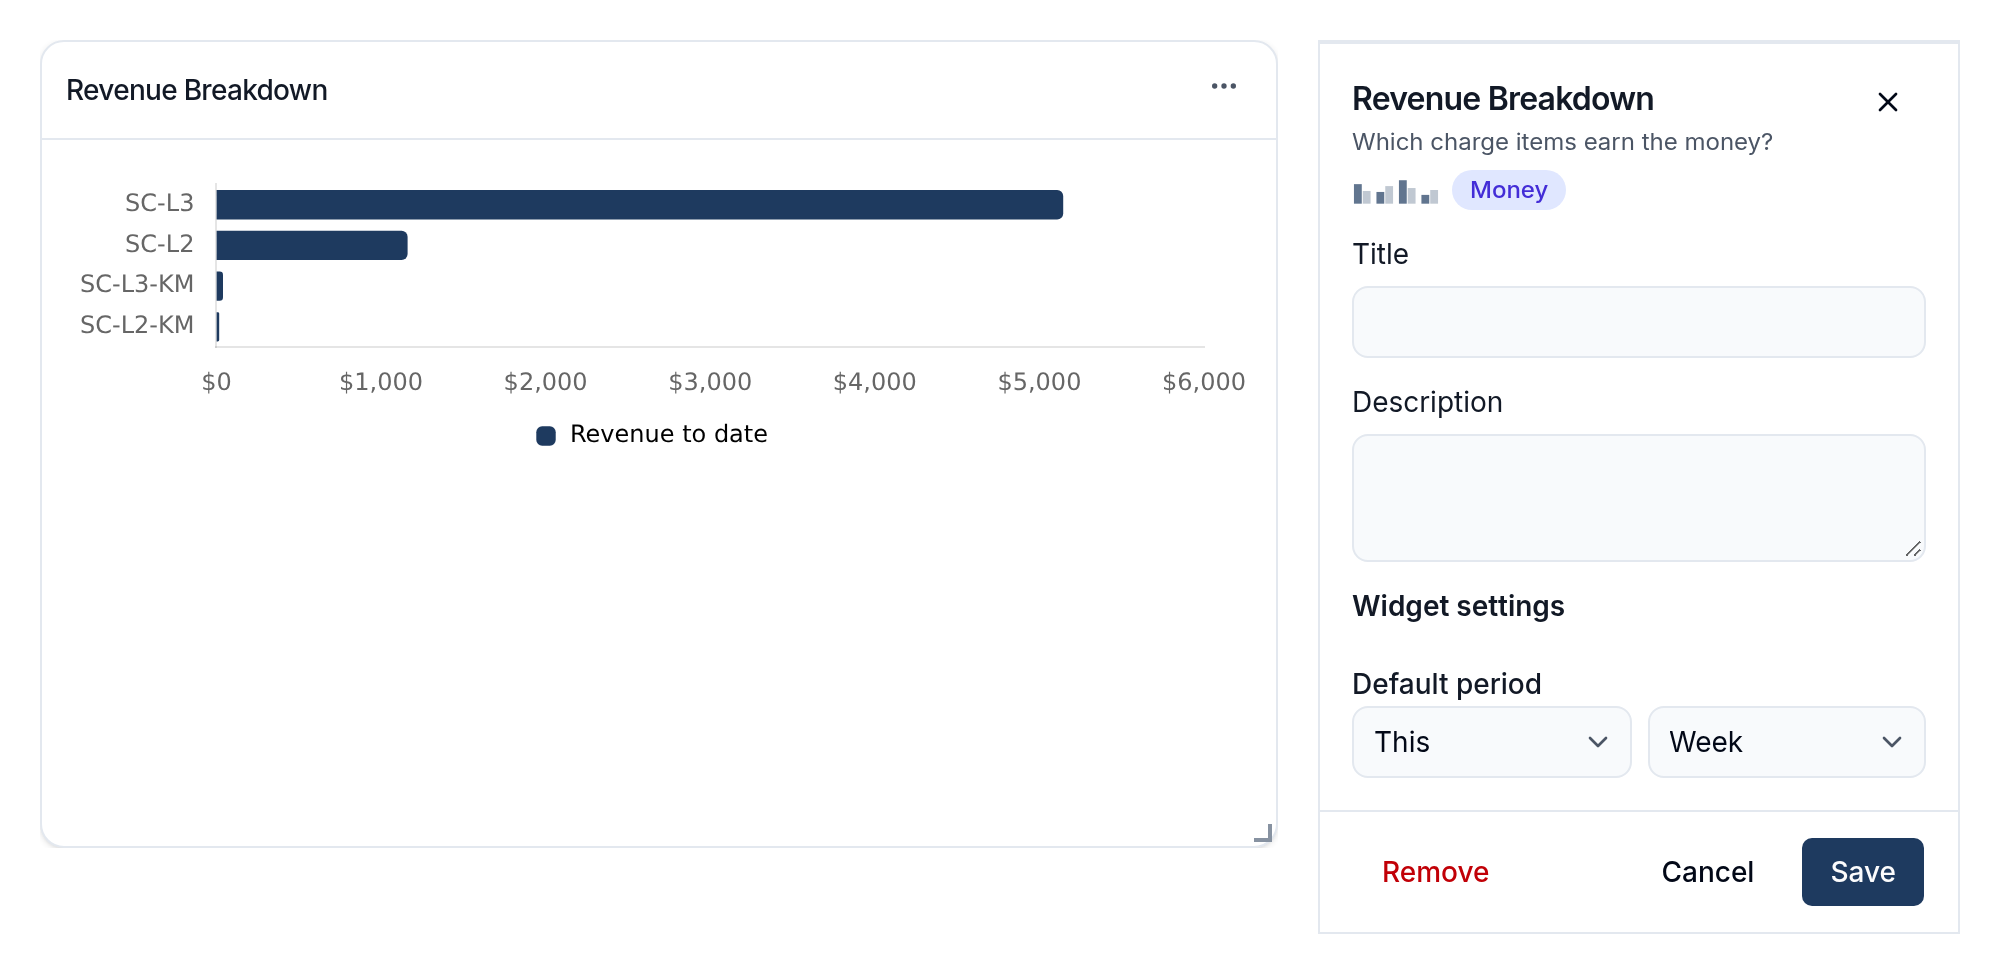
Revenue Breakdown
Shows revenue for each Charge Item, so you can see which services earn the most.
Its only setting is the Default period.
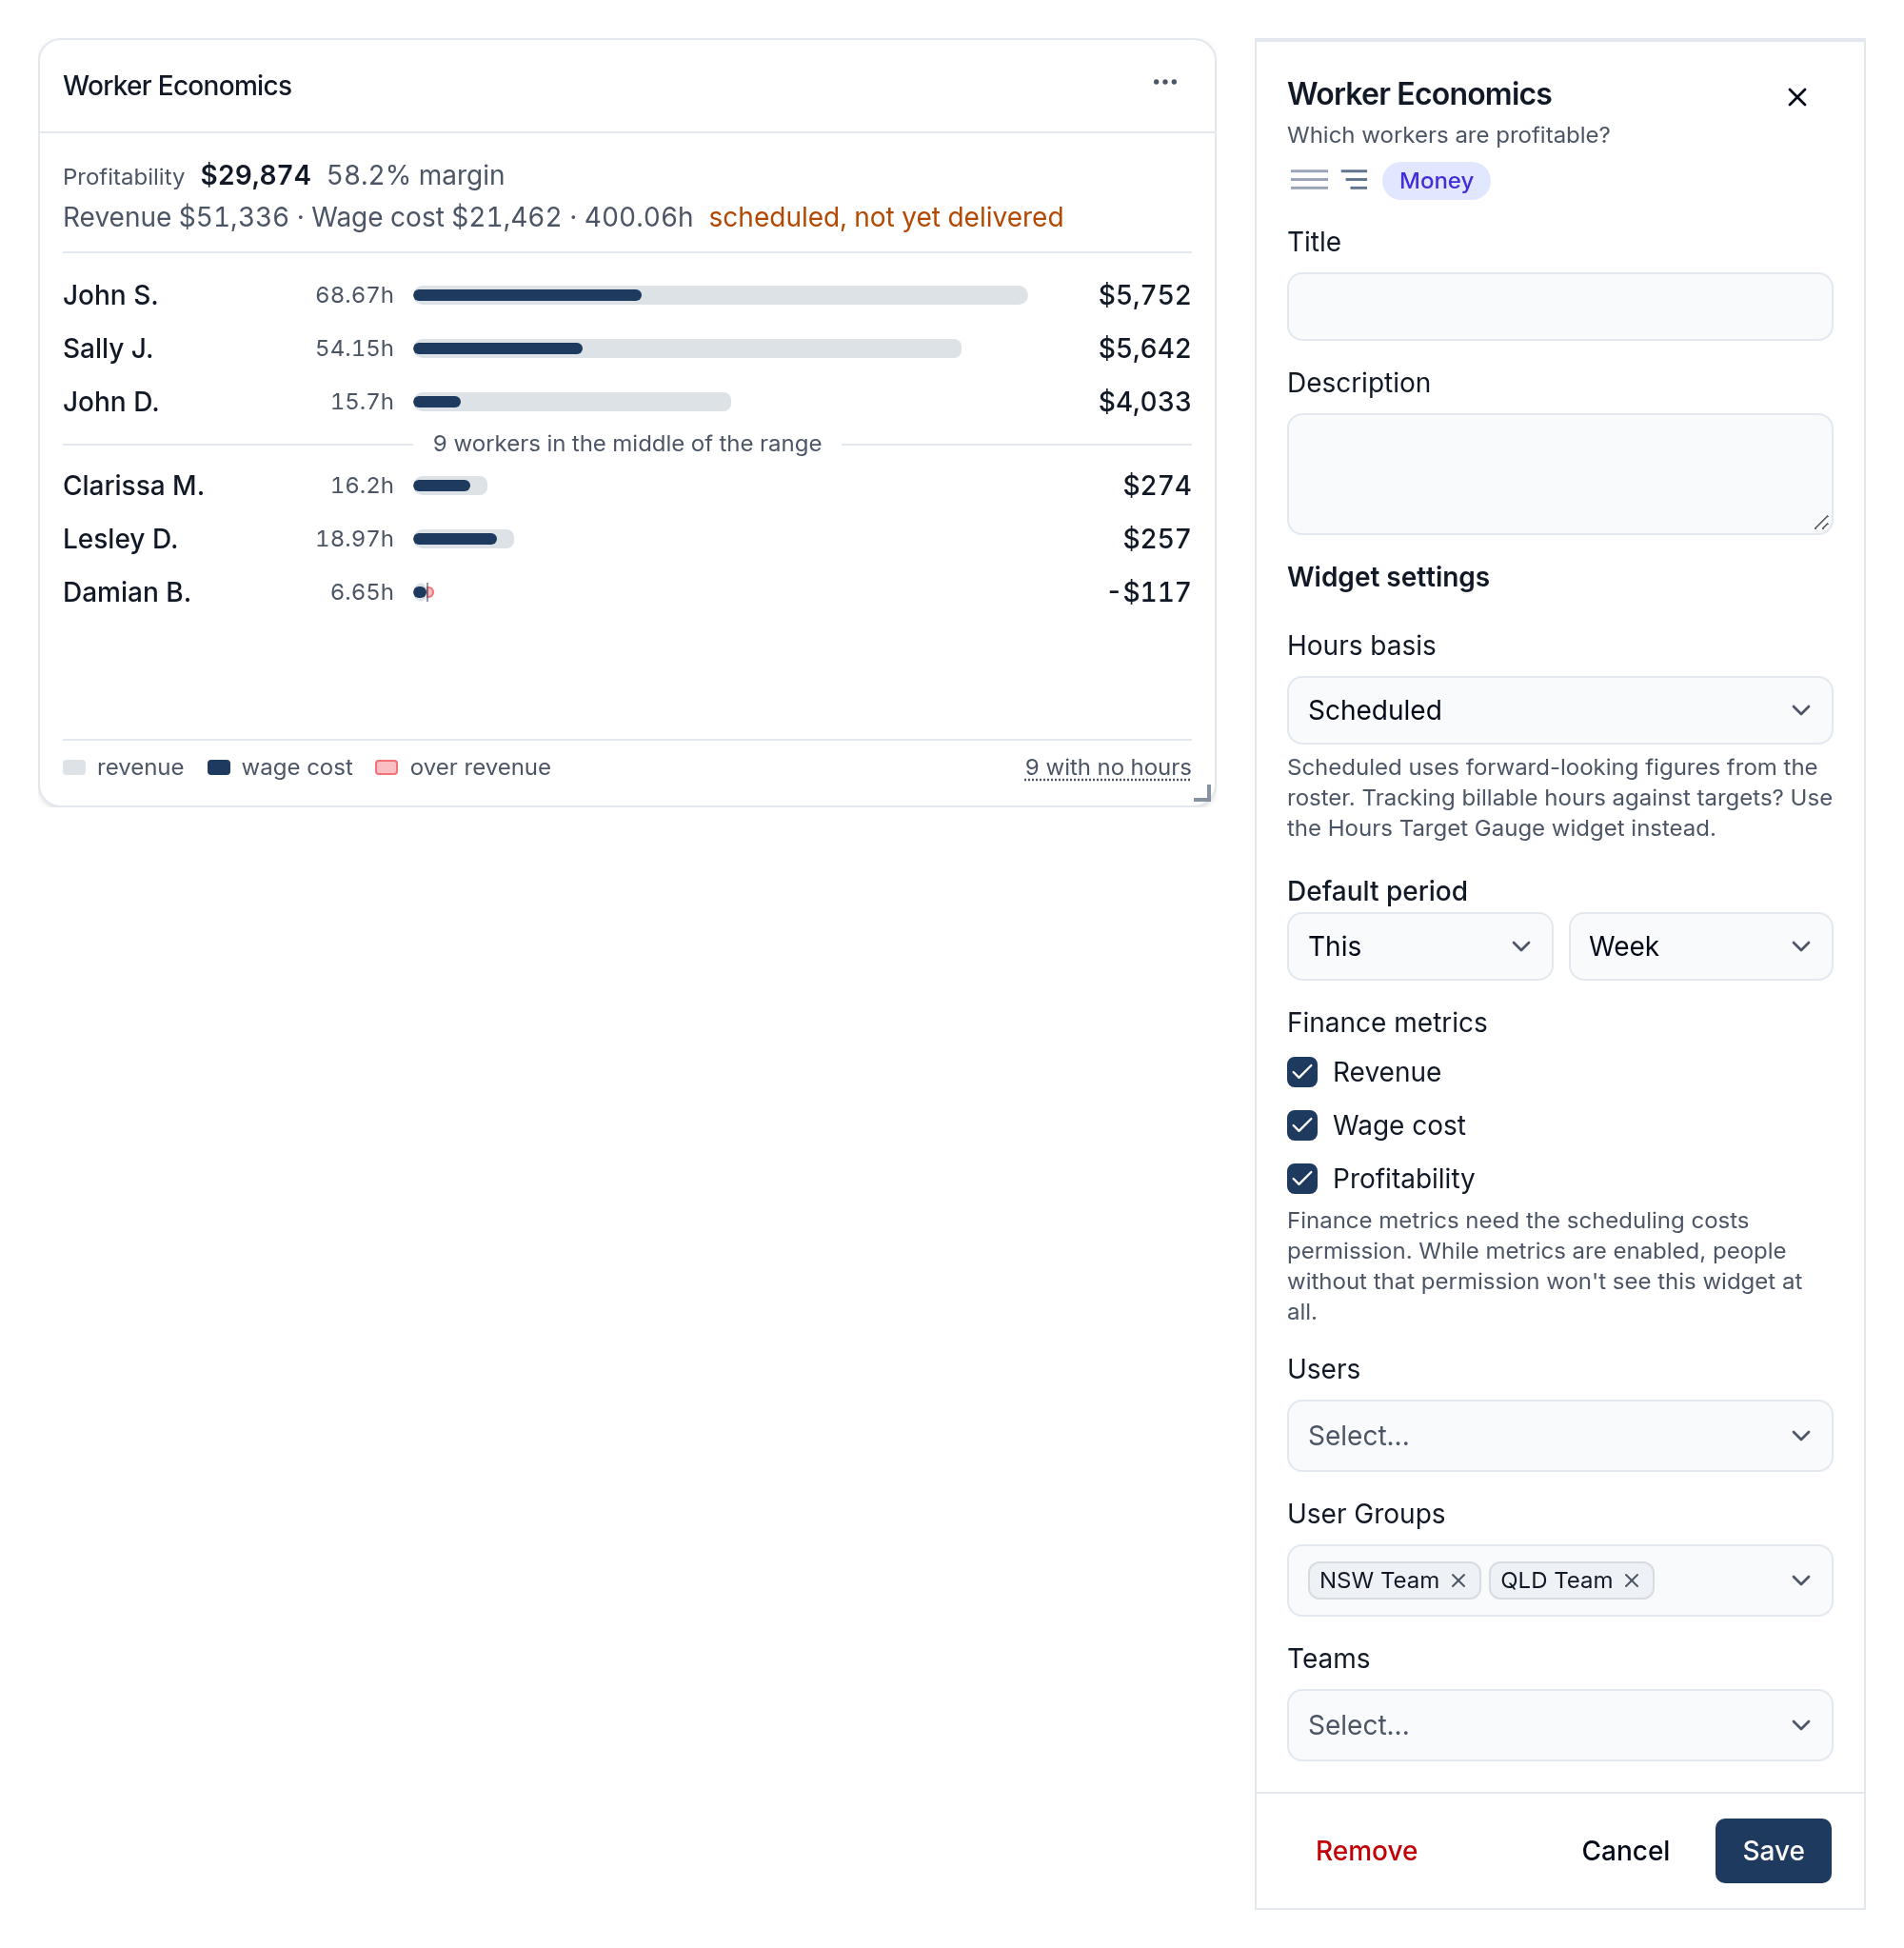
Worker Economics
Compares each Support Worker's hours with the revenue they generated and their wage cost, so you can see who is profitable and who costs more than they bring in.
- Hours basis - Approved, Scheduled or Clocked hours. Scheduled uses forward-looking figures from the roster.
- Default period.
- Finance metrics - tick Revenue, Wage cost and Profitability to show them. Finance metrics need access to scheduling costs, and while any is ticked, people without that access don't see the widget at all.
- Users, User Groups and Teams - the workers to compare.
To track billable hours against targets, use Hours Target Gauge instead.
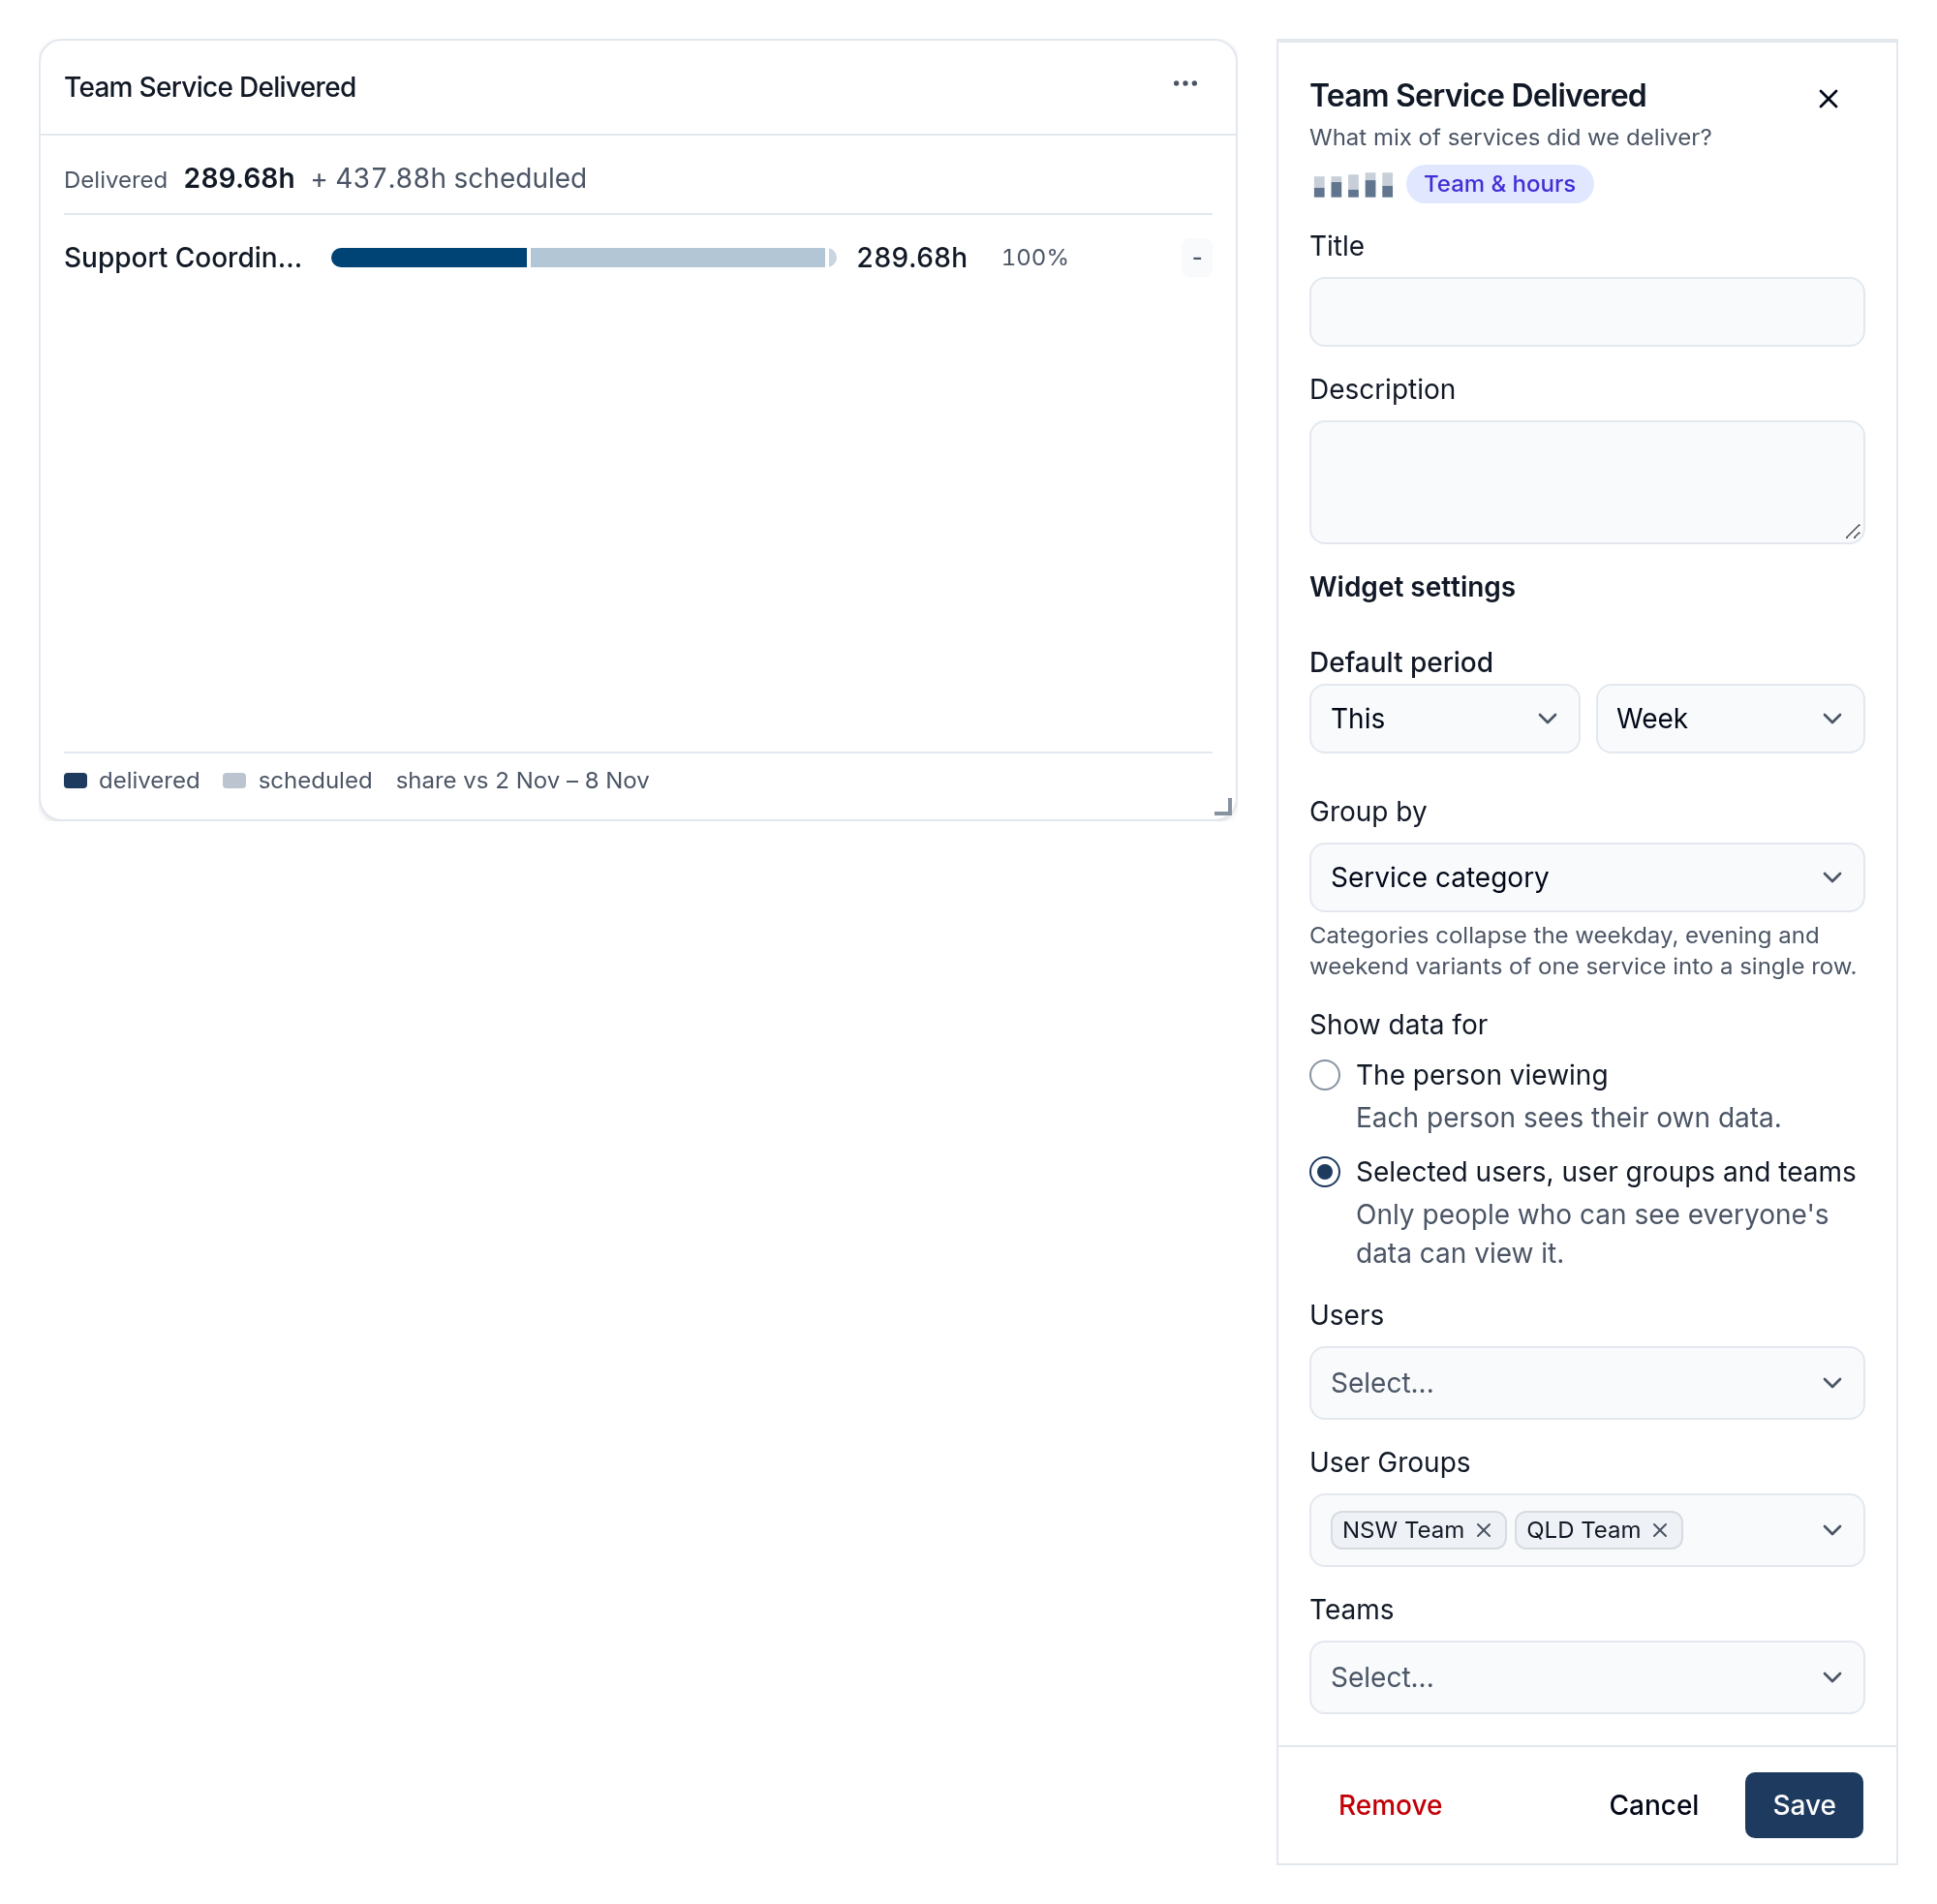
Team Service Delivered
Shows the mix of billable hourly services your team delivered, with delivered and scheduled hours, against the previous period.
- Default period.
- Group by - Service category collapses the weekday, evening and weekend variants of one service into a single row; Support item lists each one separately.
- Show data for, Users, User Groups and Teams.
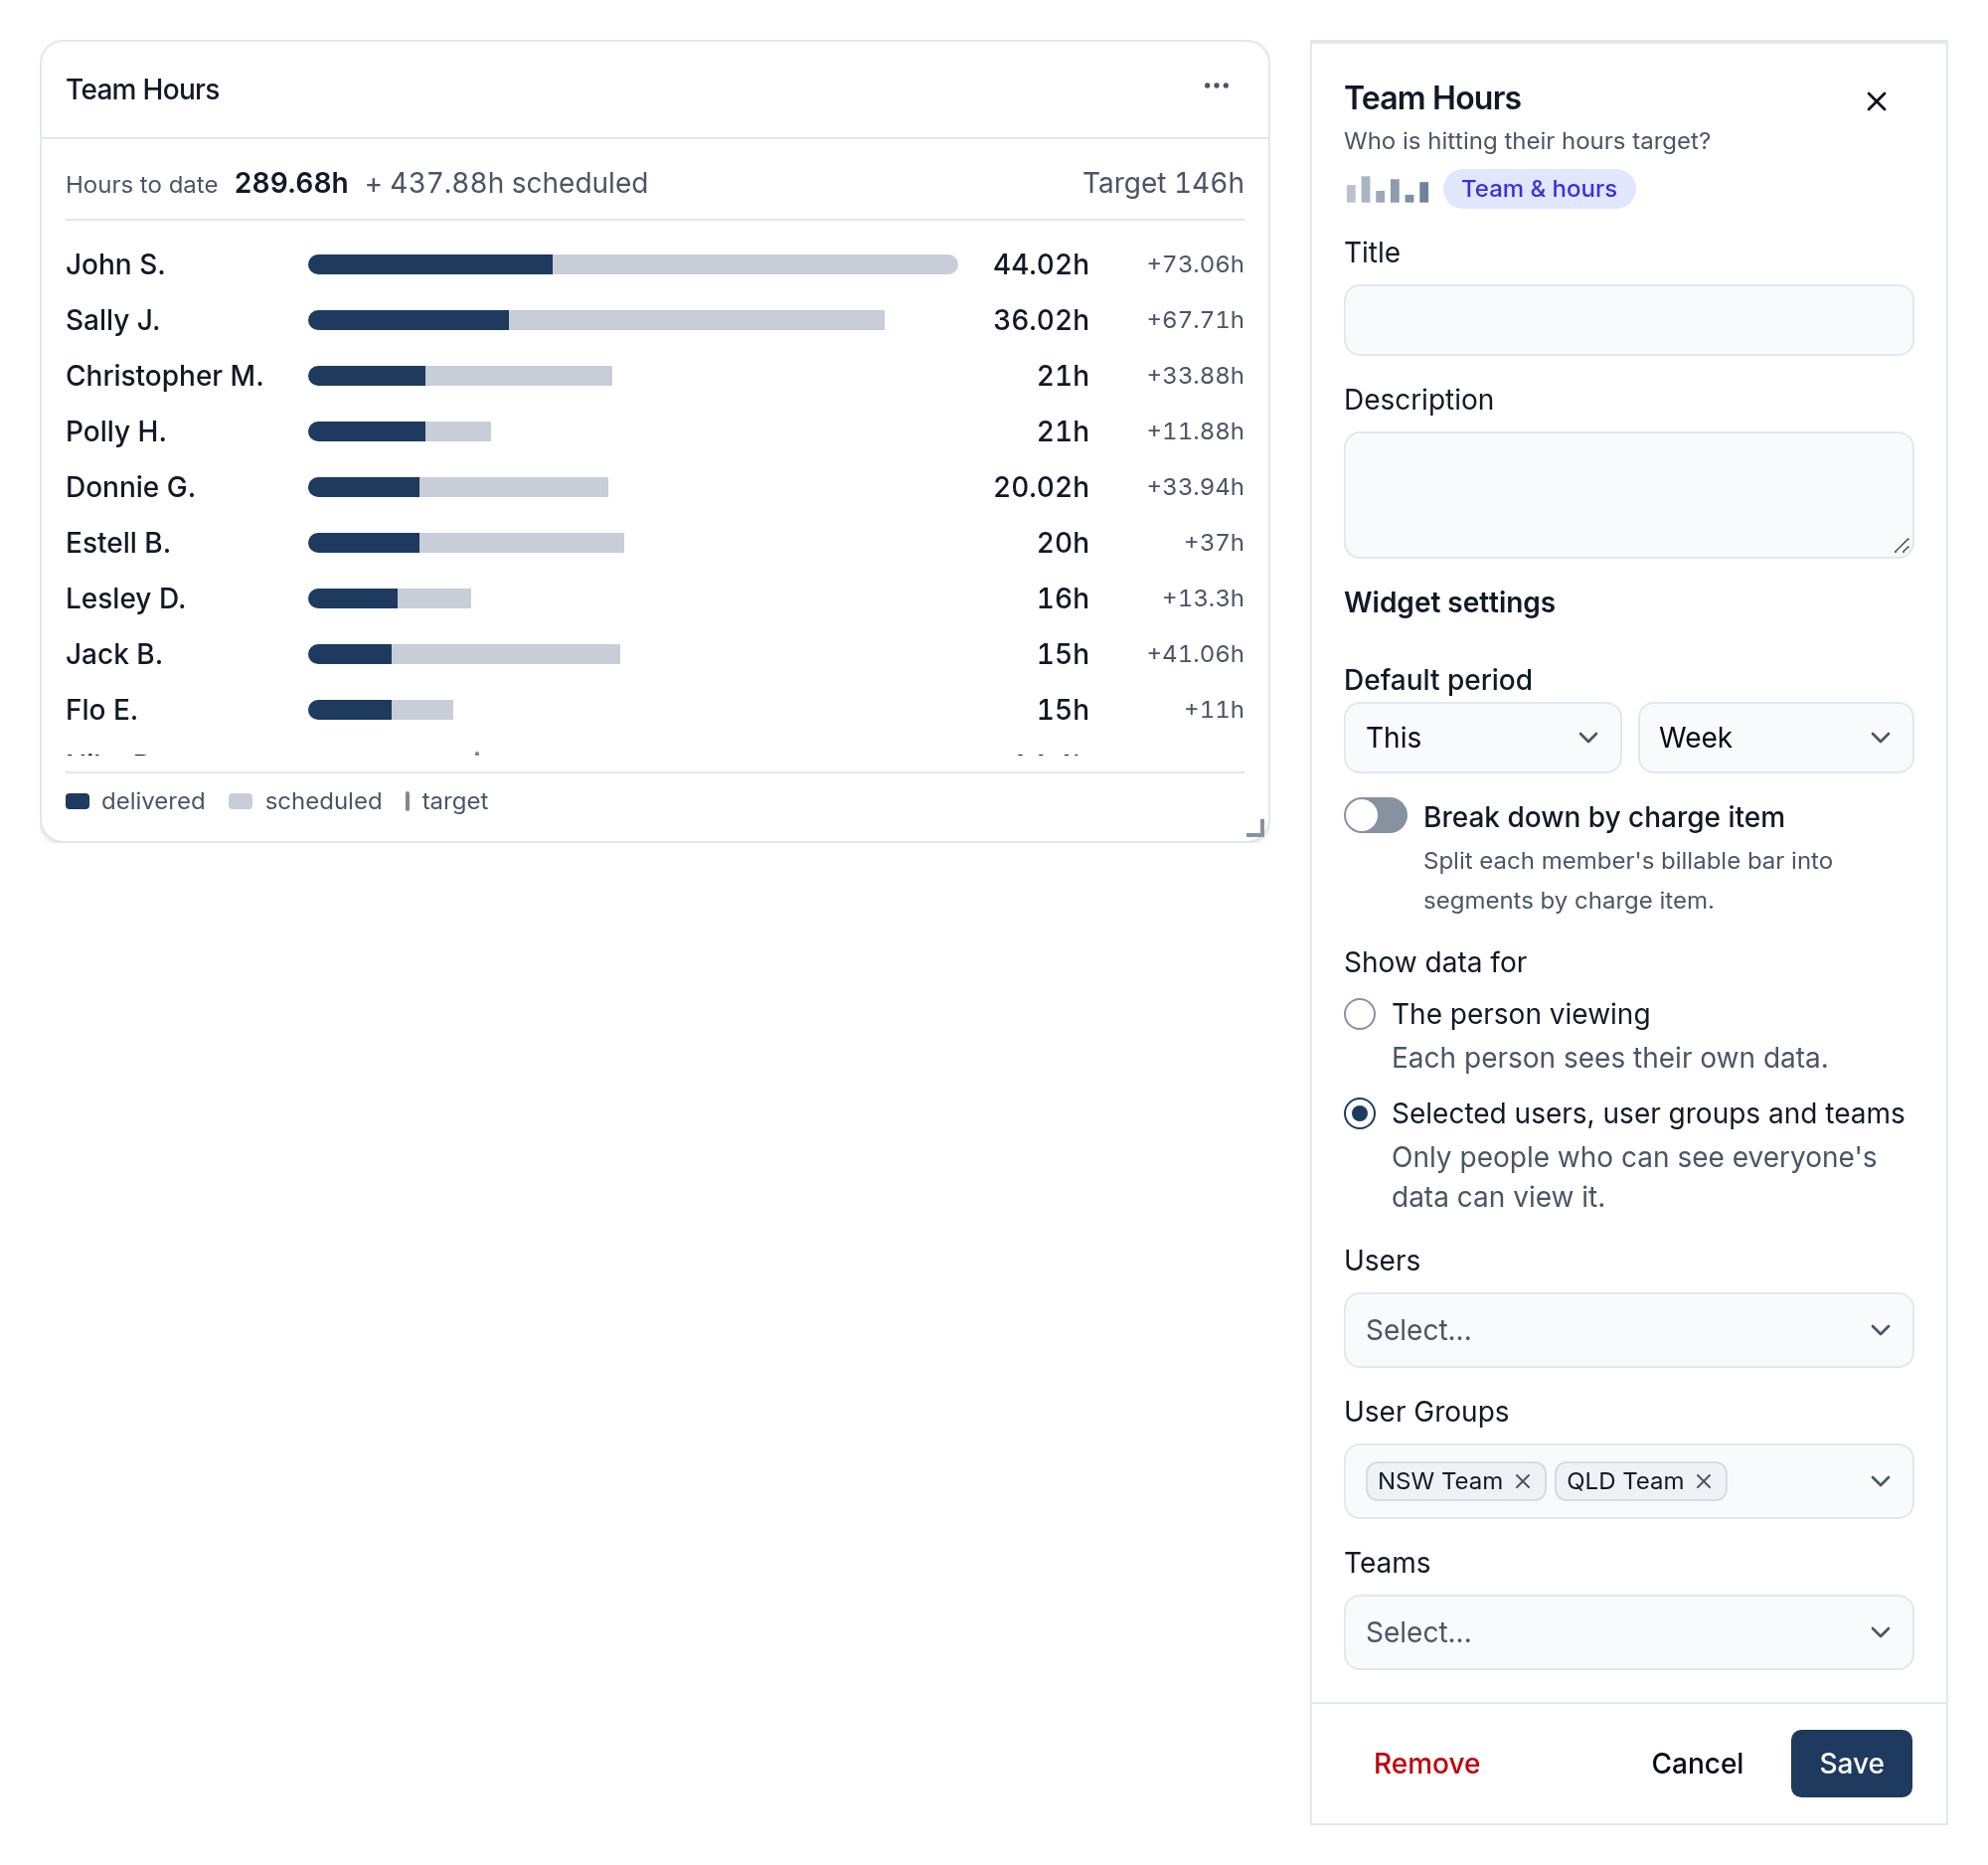
Team Hours
Shows each team member's billable hours against their target, split into delivered and scheduled hours.
- Default period.
- Break down by charge item - split each member's bar into segments by Charge Item.
- Show data for, Users, User Groups and Teams.
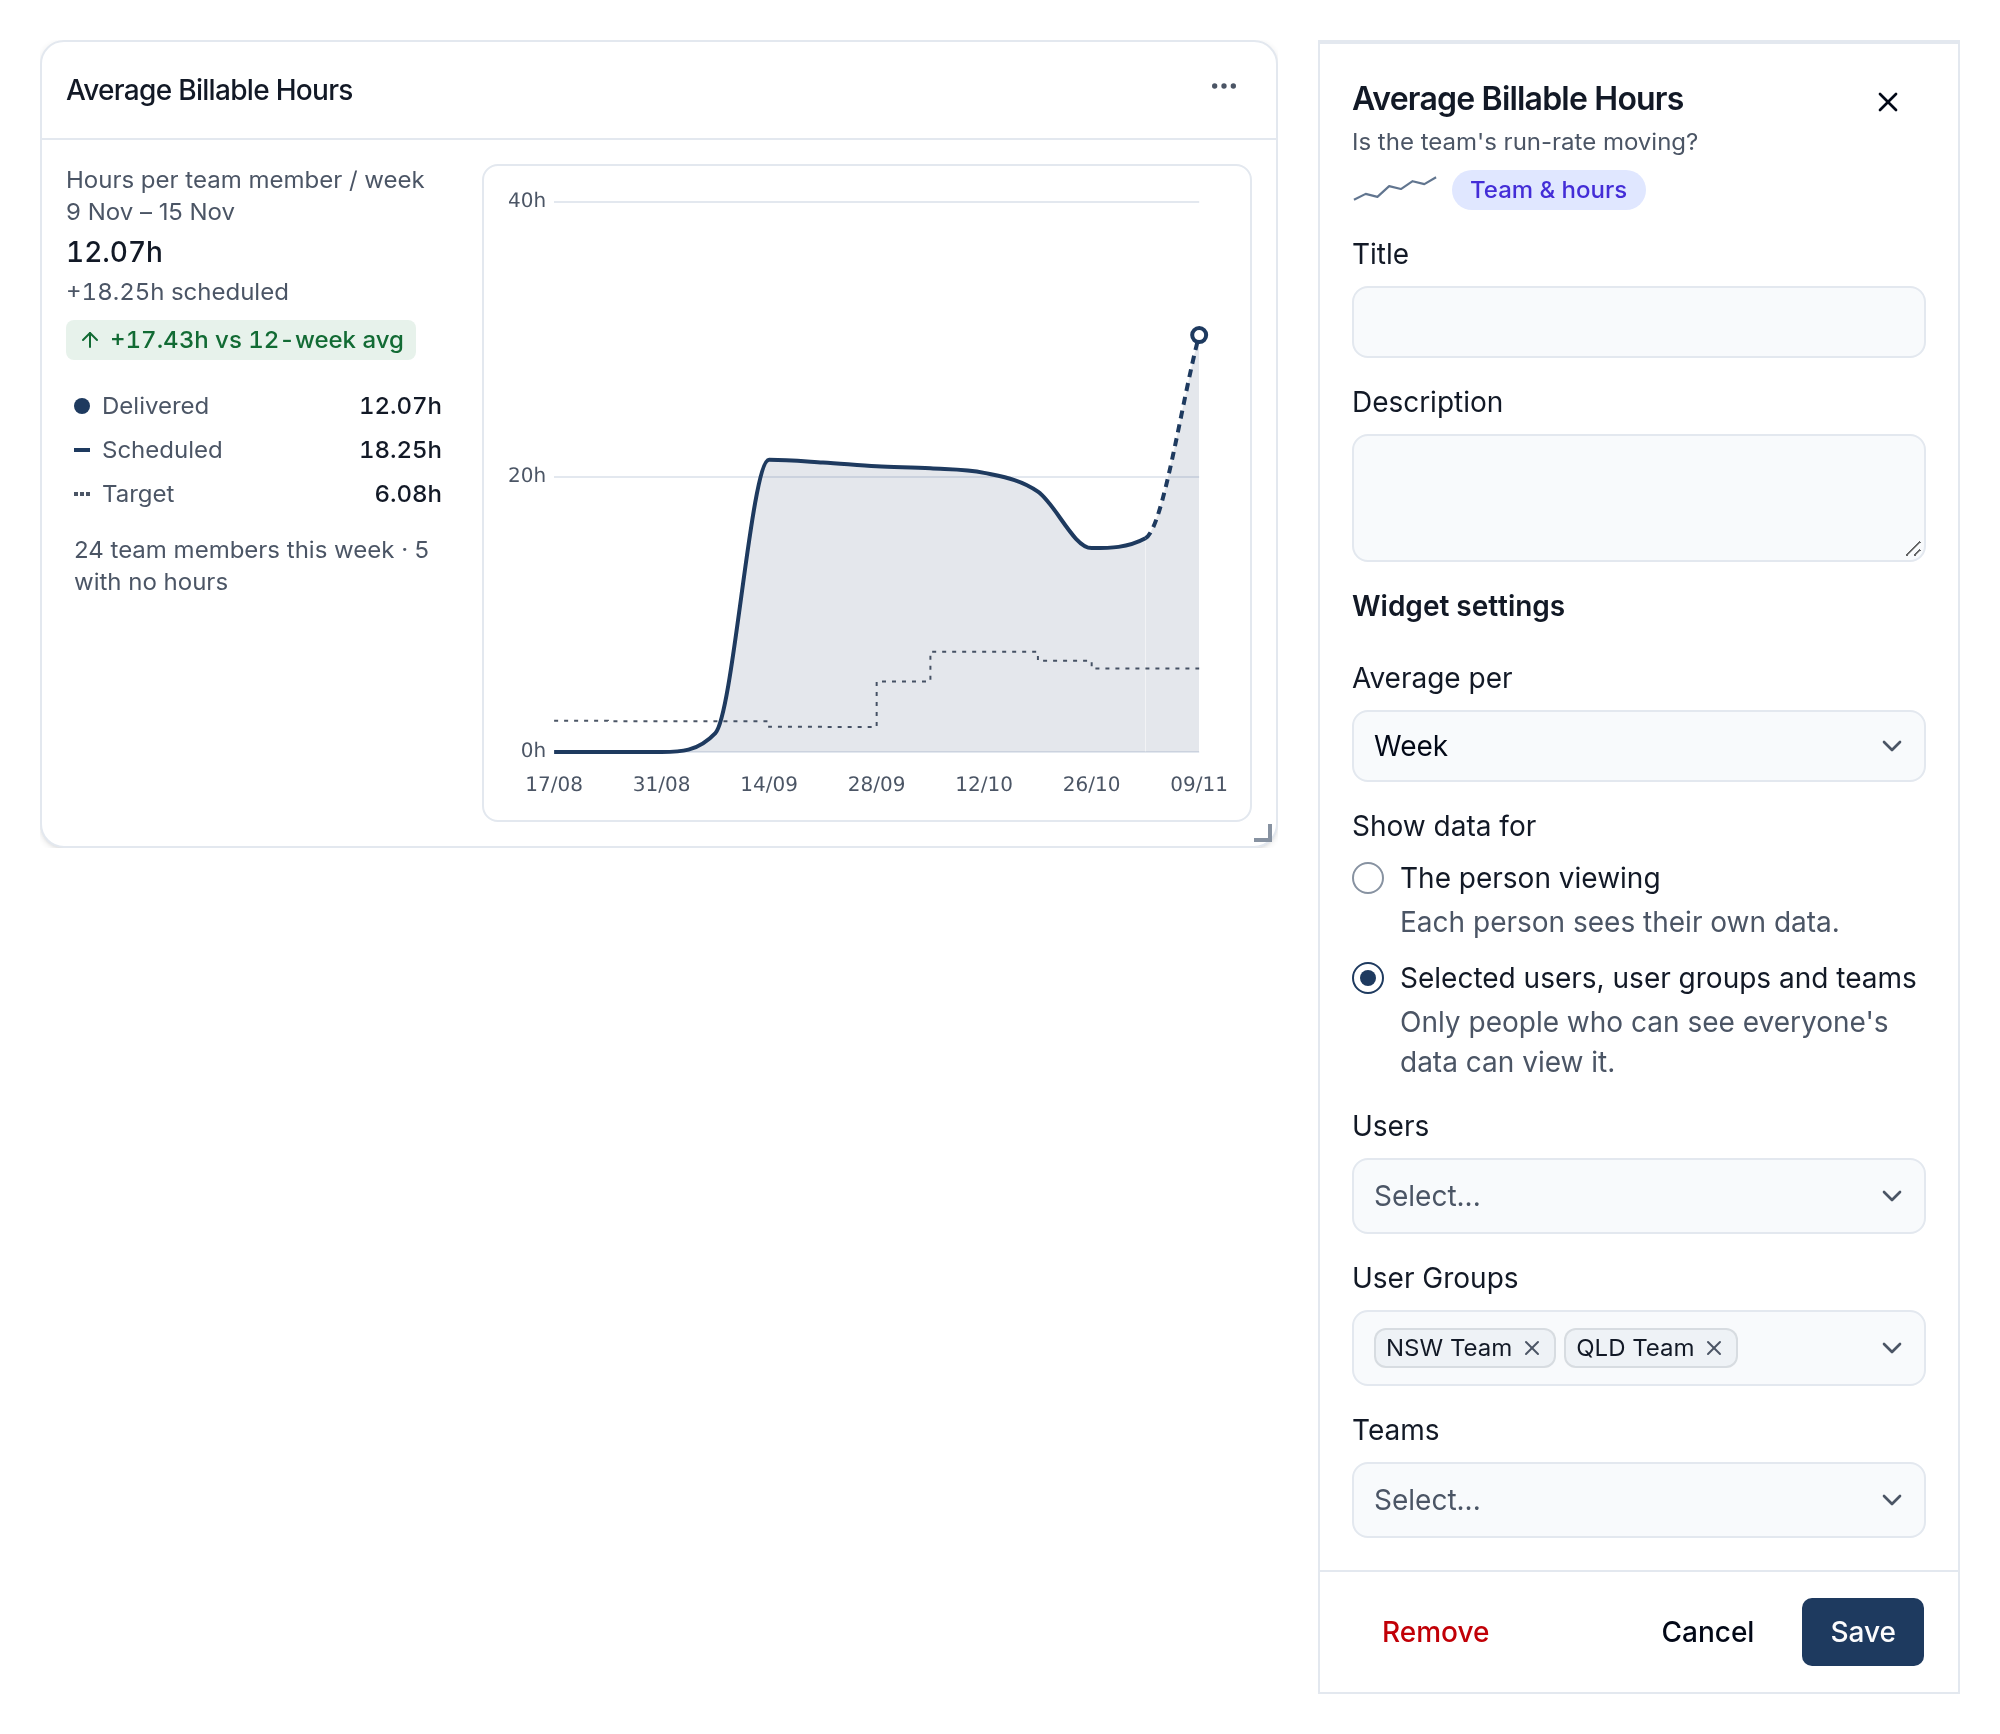
Average Billable Hours
Shows billable hours per team member over time, against the average target, so a change in your team's run rate stands out.
- Average per - Week, Fortnight, Month or Quarter.
- Show data for, Users, User Groups and Teams.
Hours Target Gauge
Shows your team's billable hours against target as a single gauge, splitting delivered from scheduled hours and marking where you'd expect to be by now.
- Default period.
- Show data for, Users, User Groups and Teams.
Task Backlog
Shows each team member's open tasks right now, split by how far past their due date they are: not yet due, under 7 days, 7 to 30 days and 30 days or more overdue.
- Show data for, Users, User Groups and Teams.
- Include unassigned tasks - add a row for open tasks with nobody assigned.
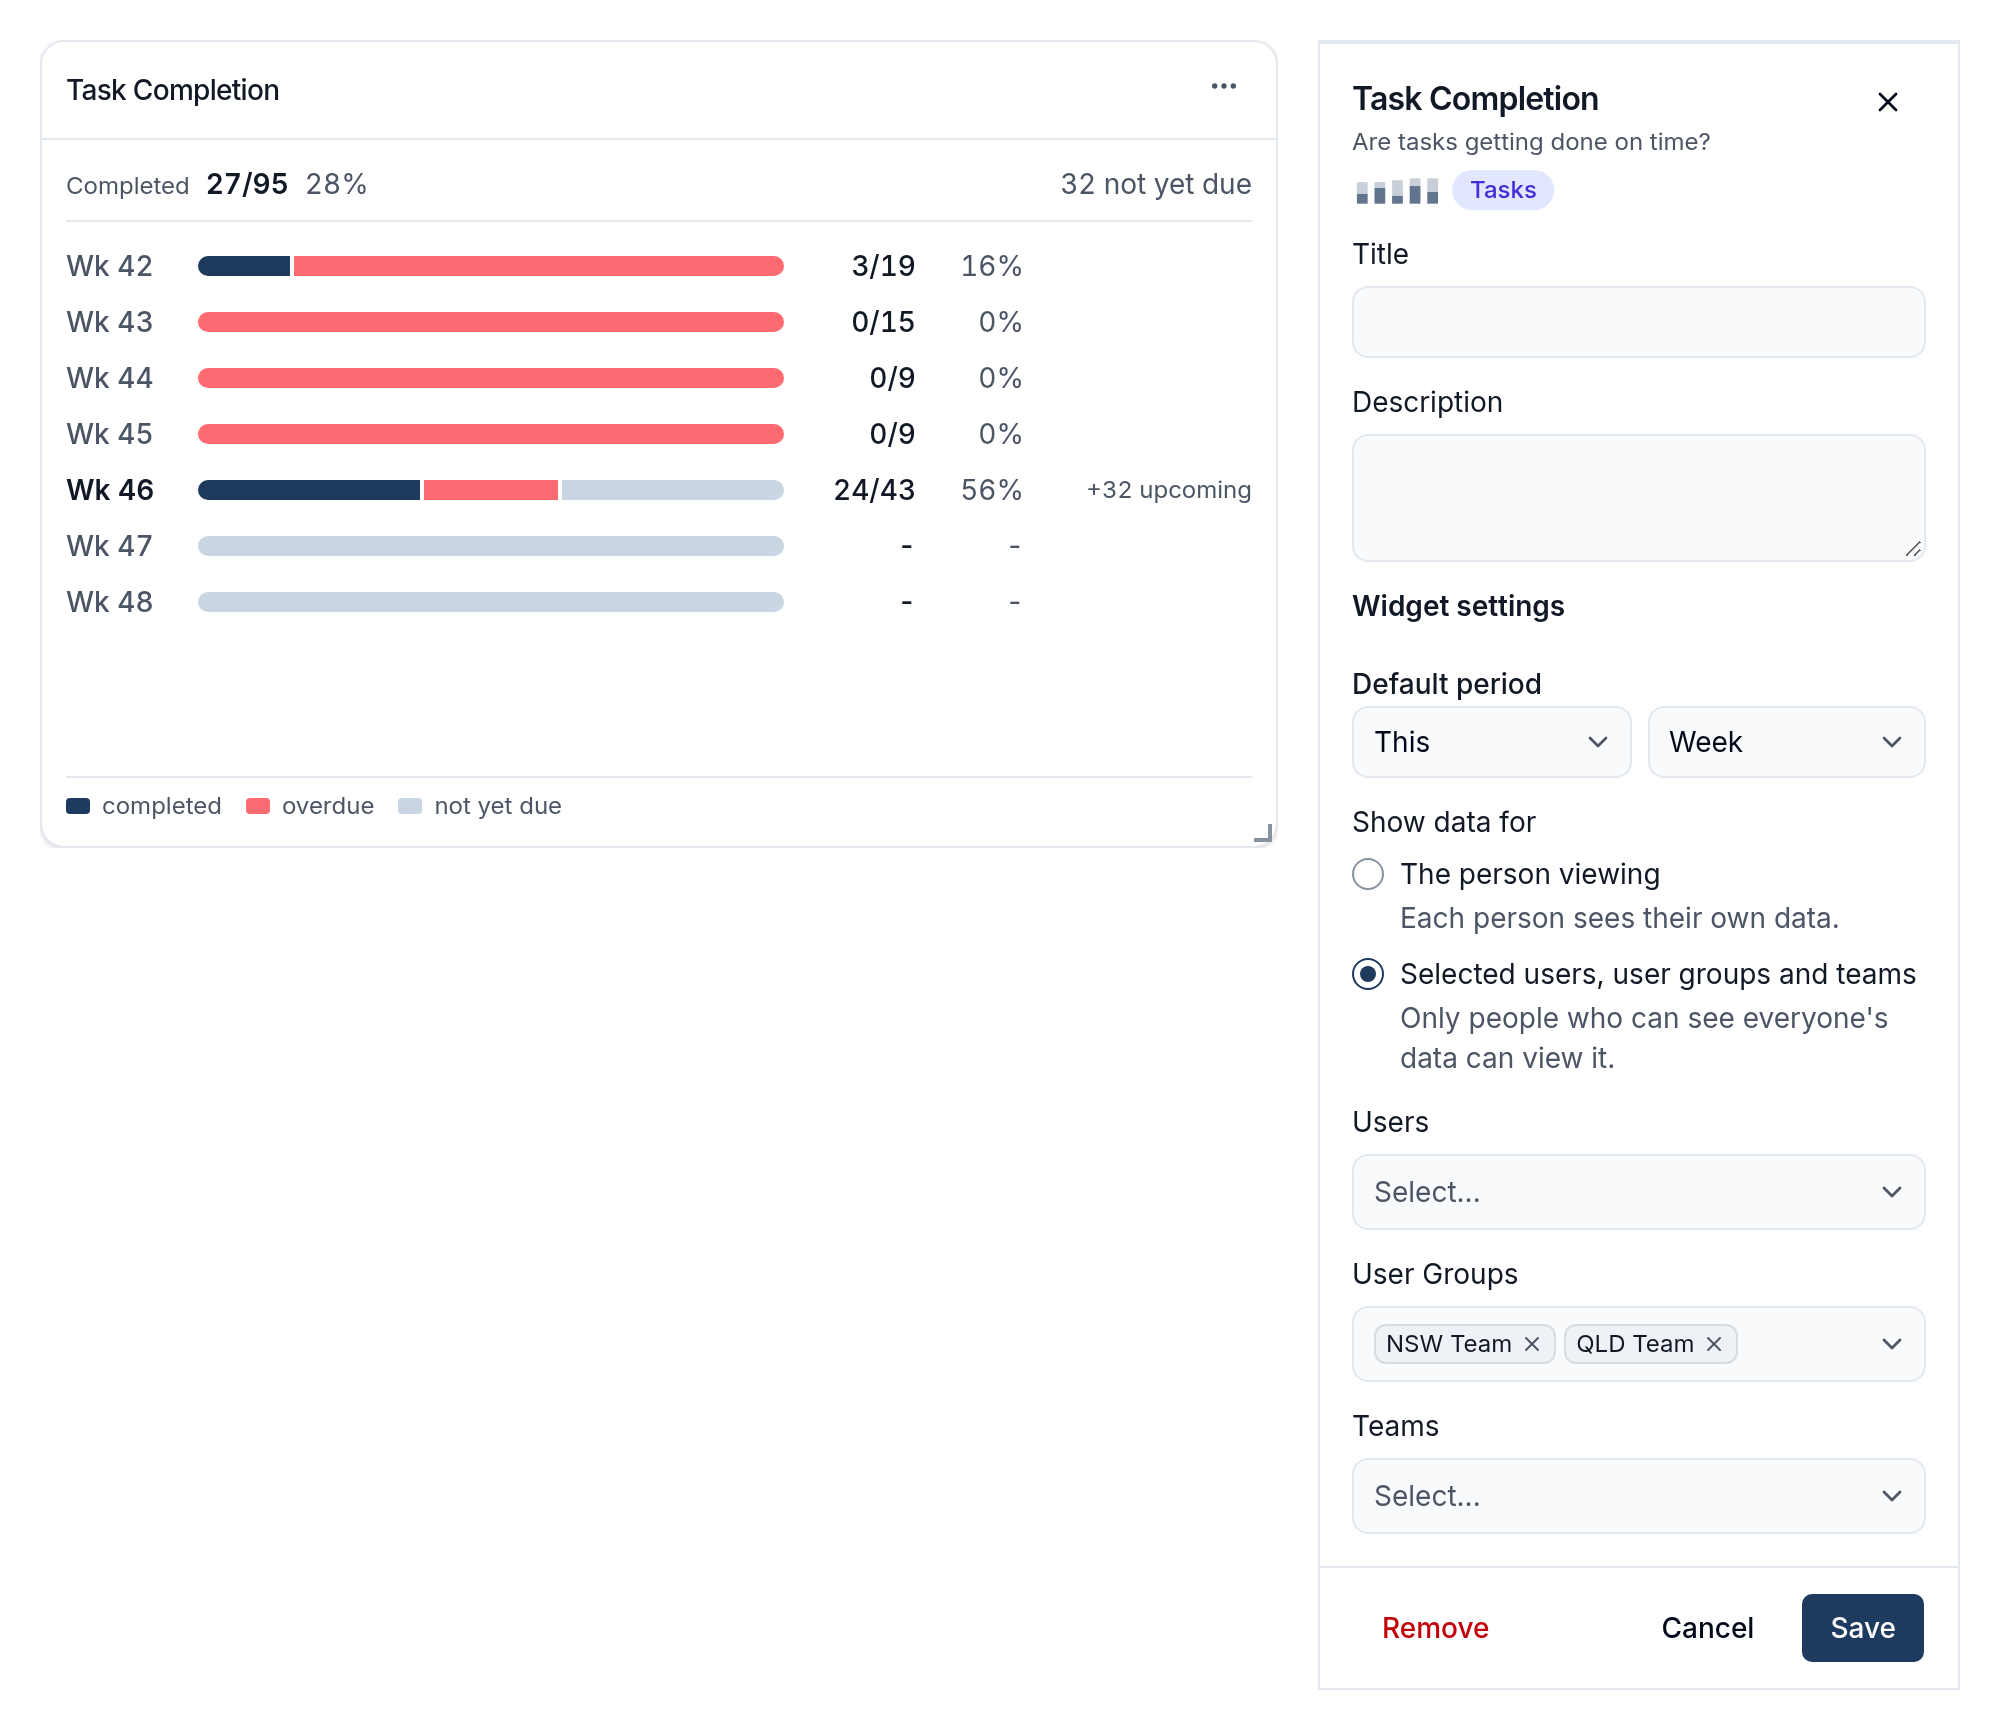
Task Completion
Shows the tasks scheduled in each period and how many are now complete, with overdue tasks called out.
- Default period.
- Show data for, Users, User Groups and Teams.
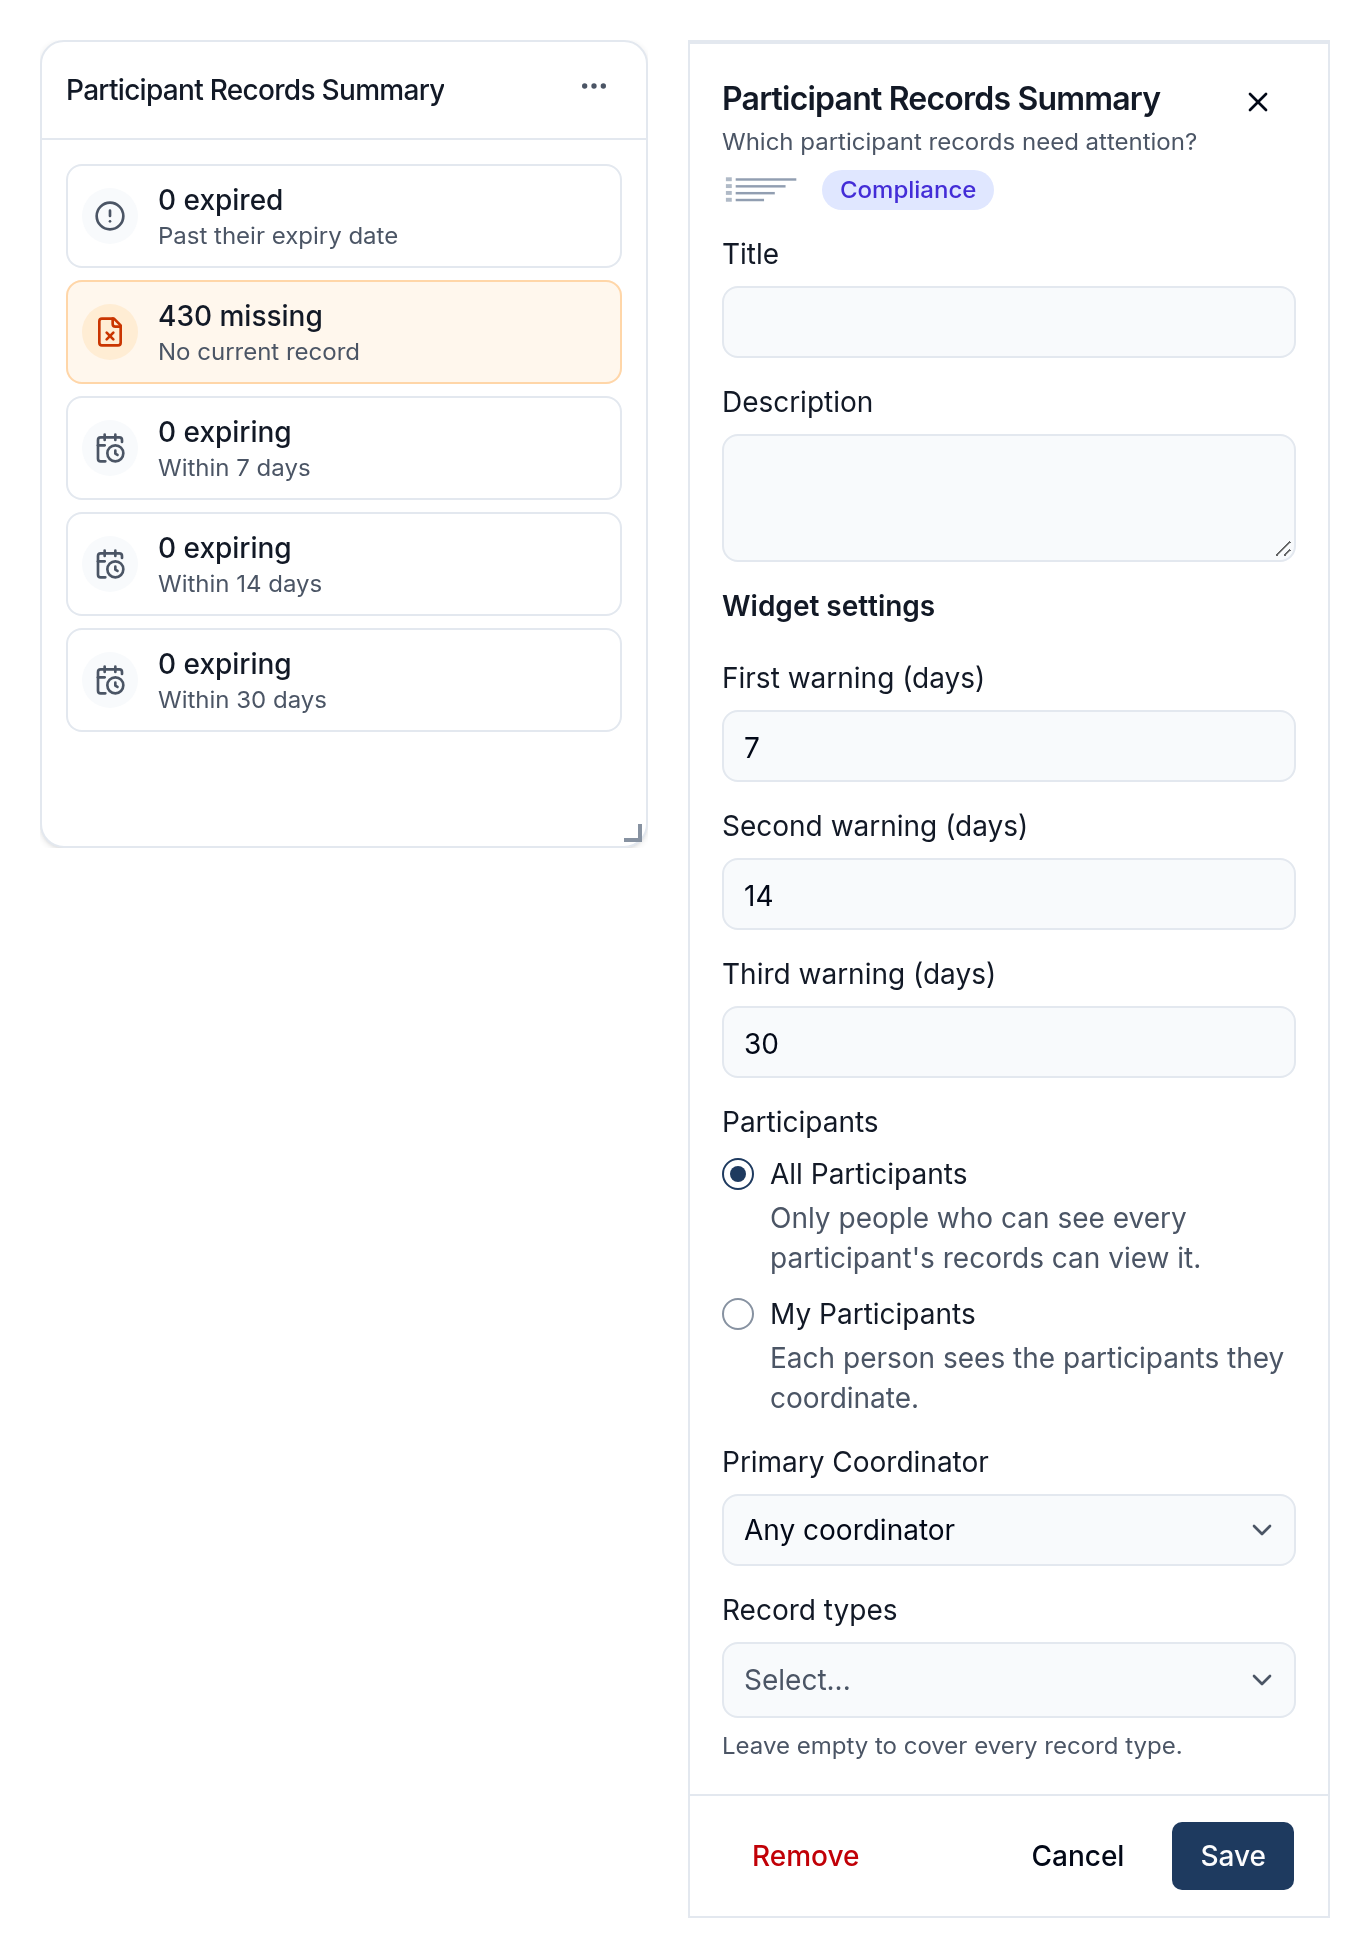
Participant Records Summary
Counts Participant records that have expired, are missing or expire soon, across every Participant.
- The three warning windows and Record types.
- Participants - All Participants counts everyone, and only people who can see every Participant's records can view the widget. My Participants shows each viewer the Participants they coordinate.
- Primary Coordinator - with All Participants, limit the count to one coordinator's Participants, or to Participants with no coordinator.
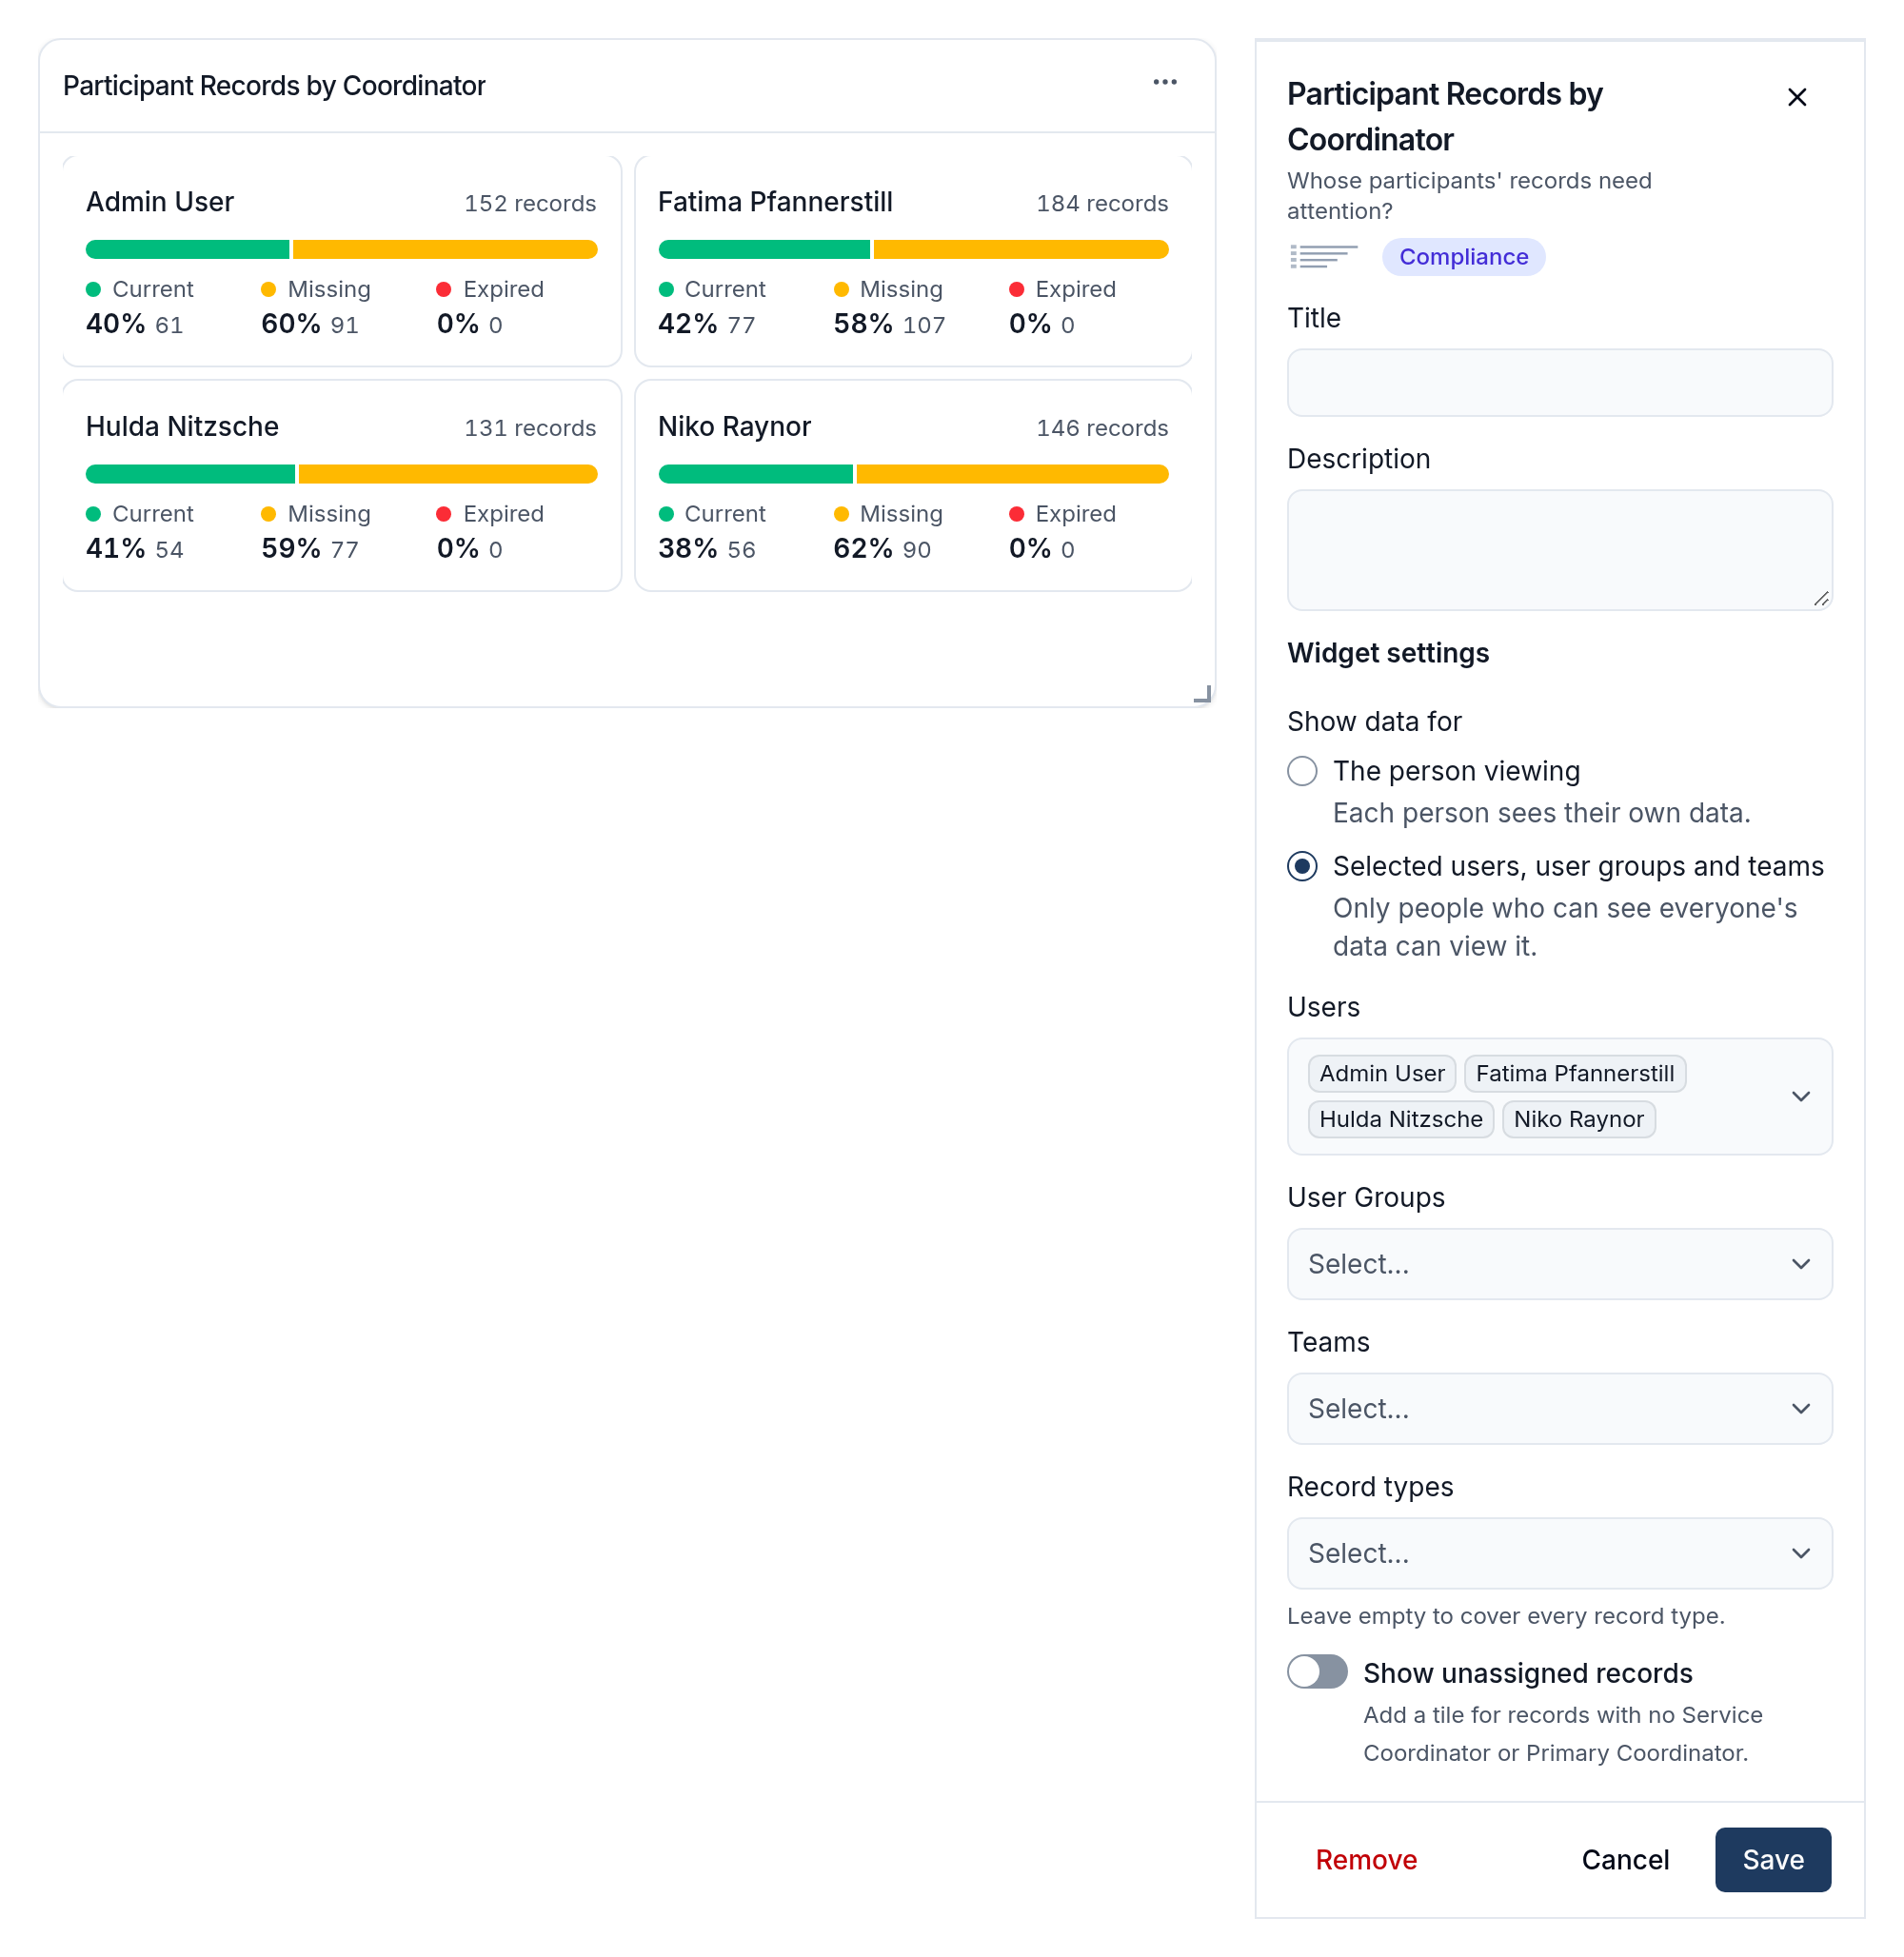
Participant Records by Coordinator
Shows each coordinator's Participant records split into current, missing and expired.
- Show data for, Users, User Groups and Teams - the coordinators to show.
- Record types.
- Show unassigned records - add a tile for records with no Service Coordinator or Primary Coordinator.
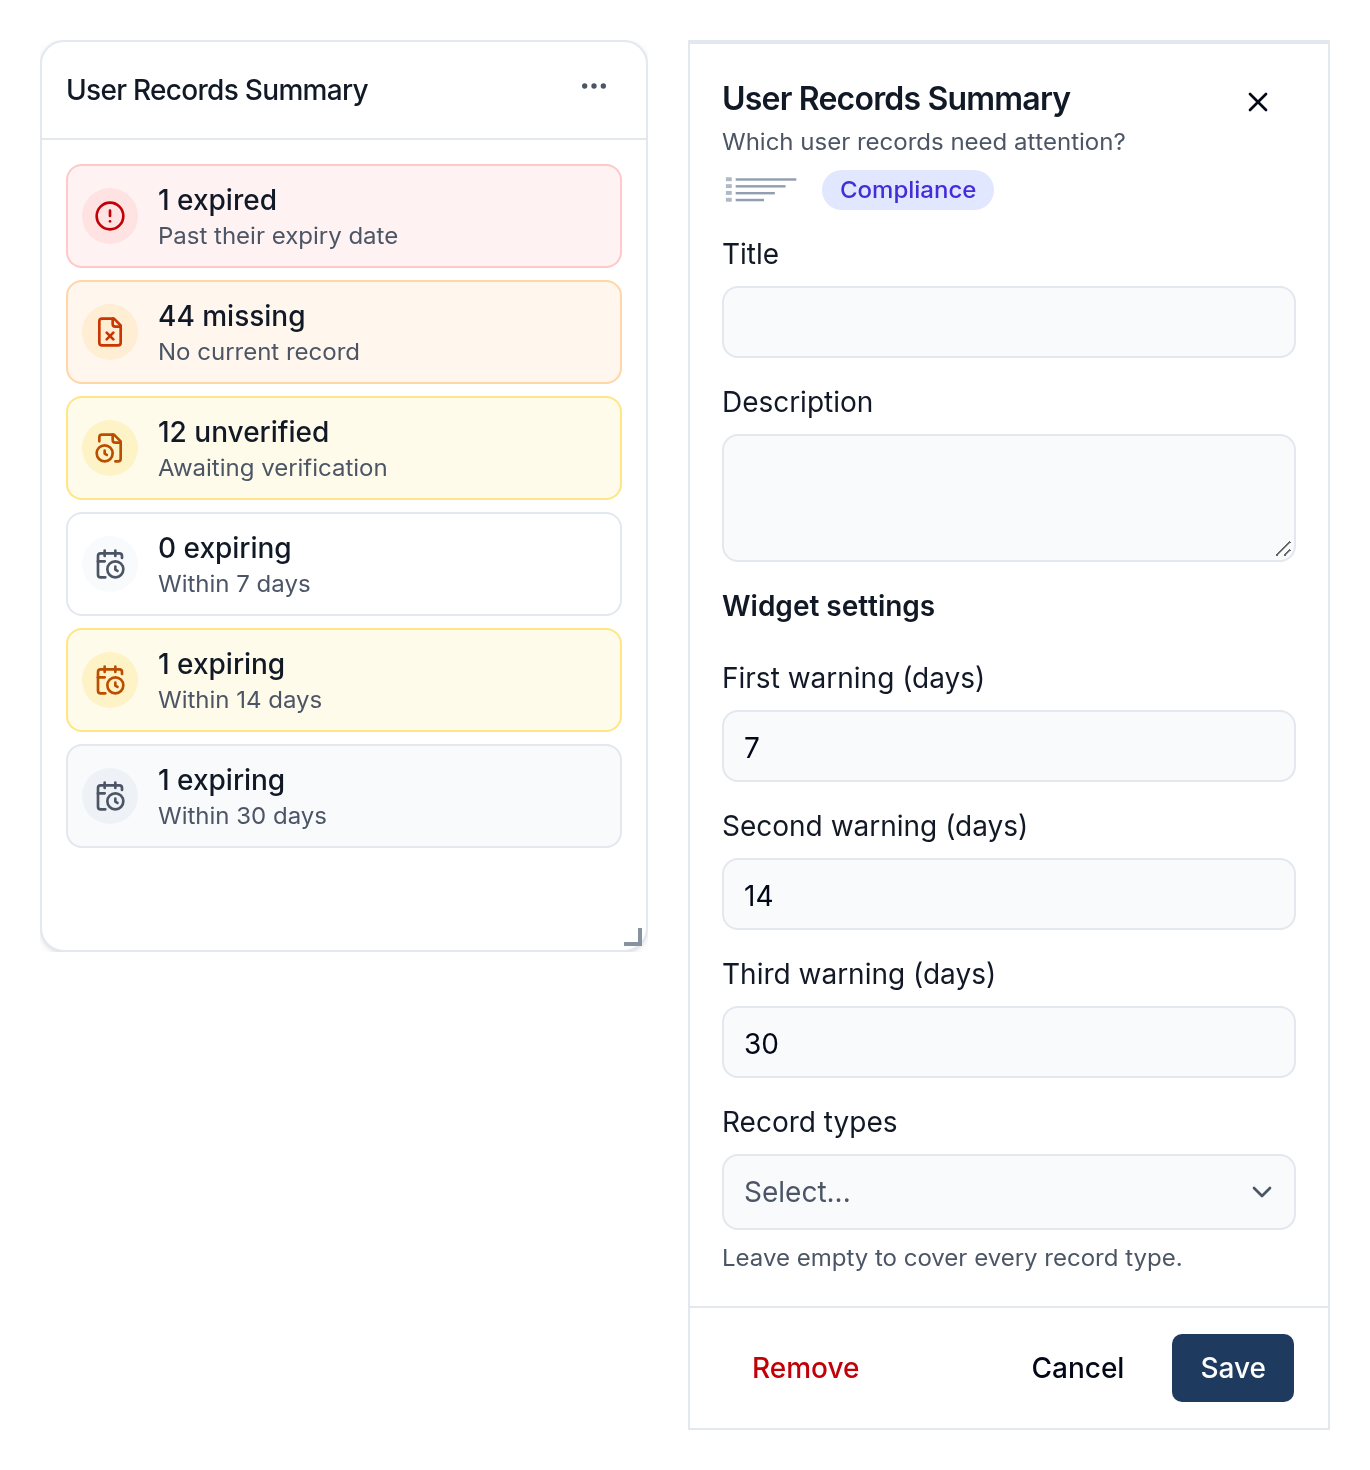
User Records Summary
Counts user records that have expired, are missing, are awaiting verification or expire soon, across every user.
Its settings are the three warning windows and Record types.
Site Records Summary
Counts site records that have expired, are missing or expire soon, across every site.
Its settings are the three warning windows and Record types.
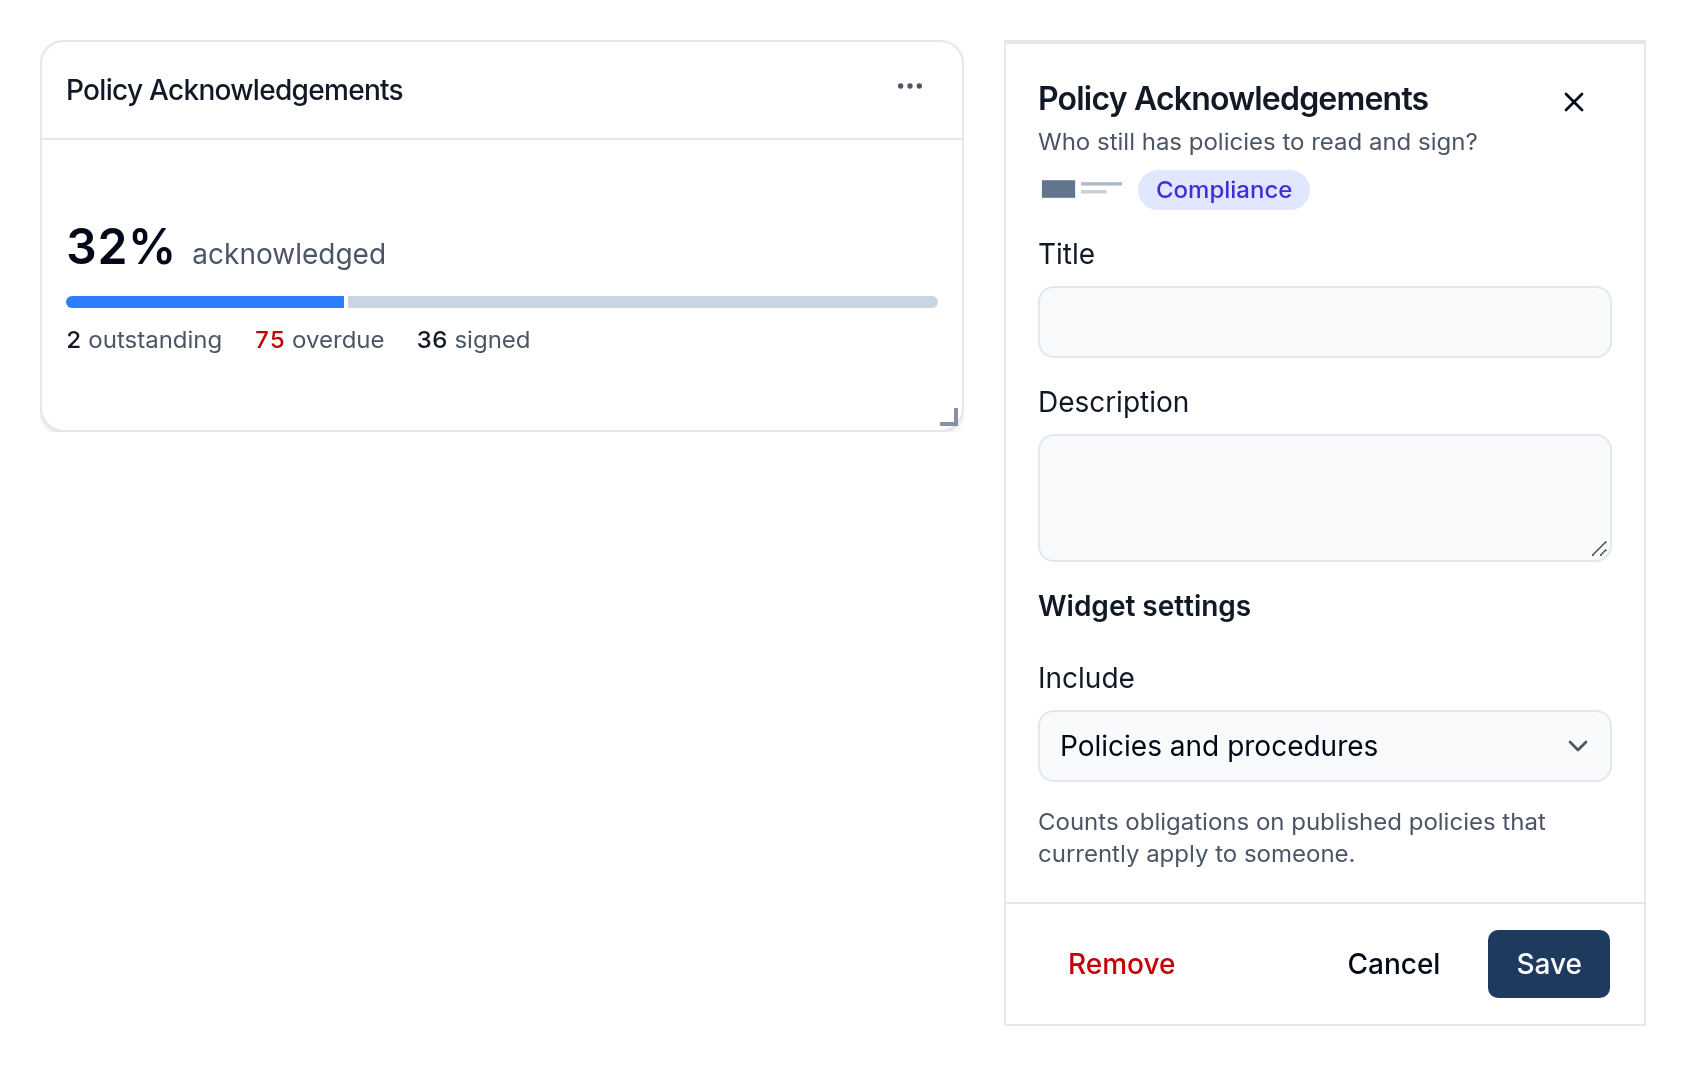
Policy Acknowledgements
Shows how much of your team has acknowledged the published policies that apply to them, with outstanding, overdue and signed counts.
Choose what to Include: Policies and procedures, Policies only or Procedures only.
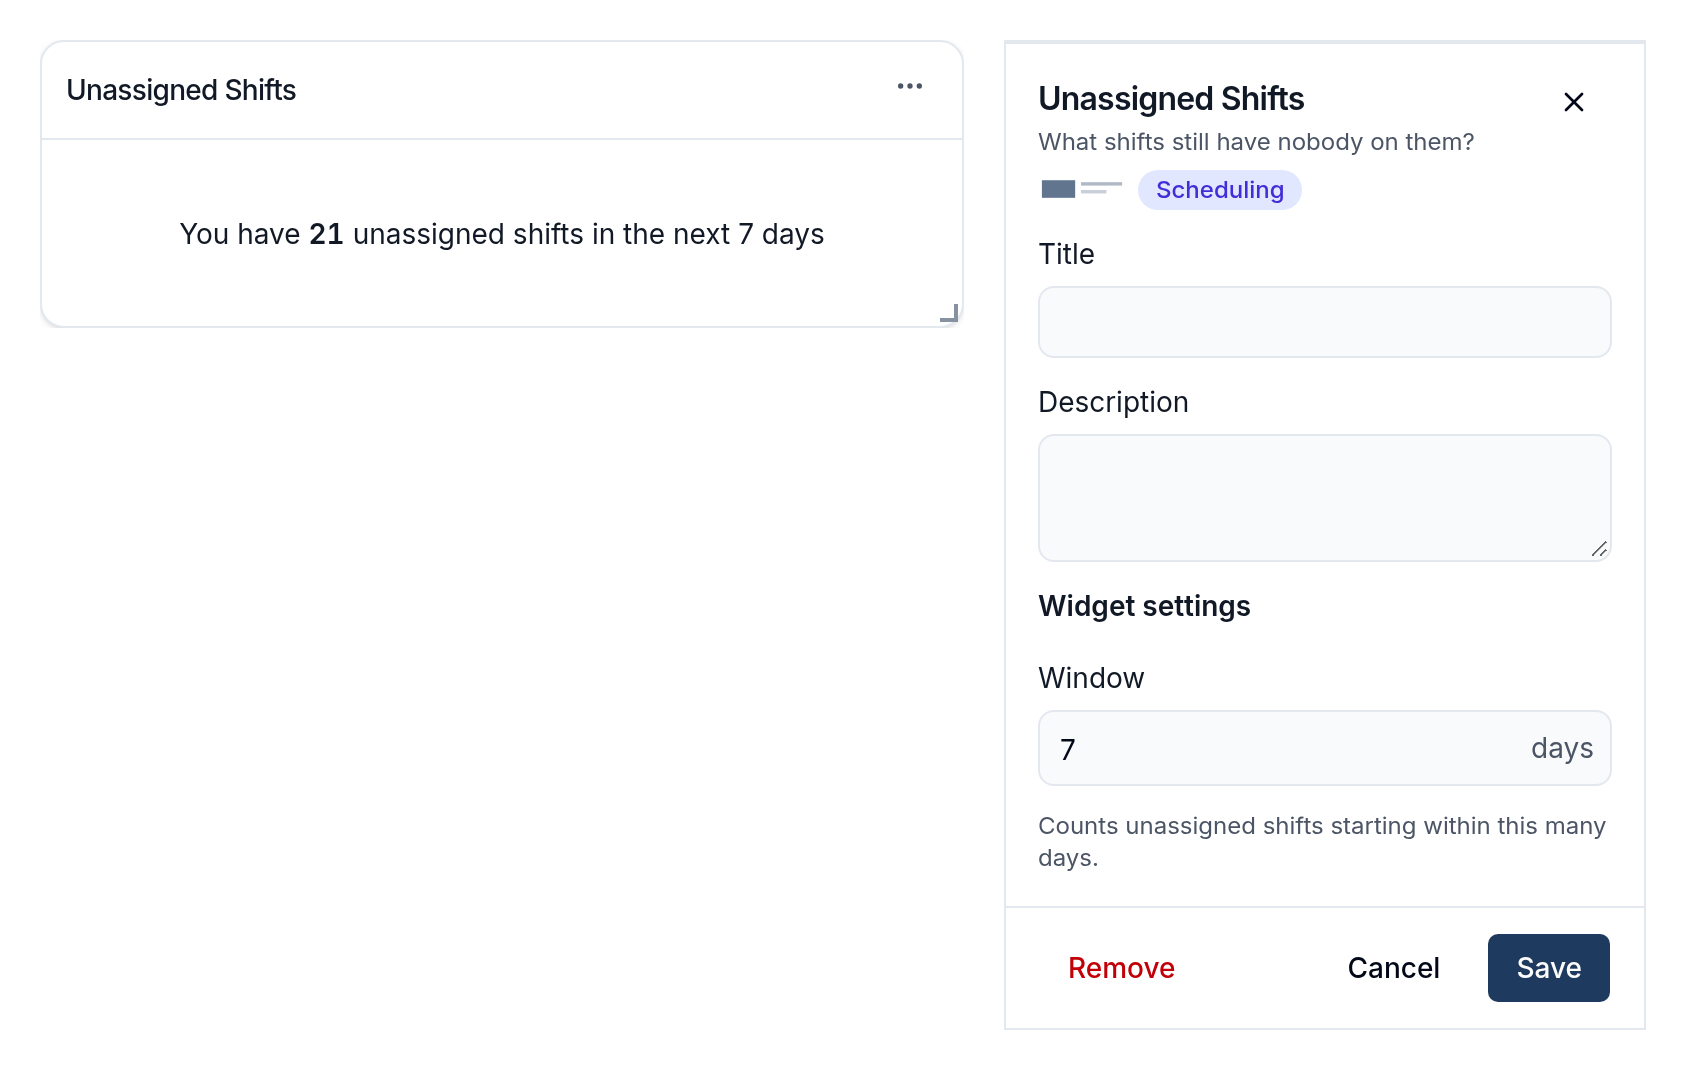
Unassigned Shifts
Counts the shifts with no assigned worker that start within the next few days.
Set the Window in days - 7 by default.
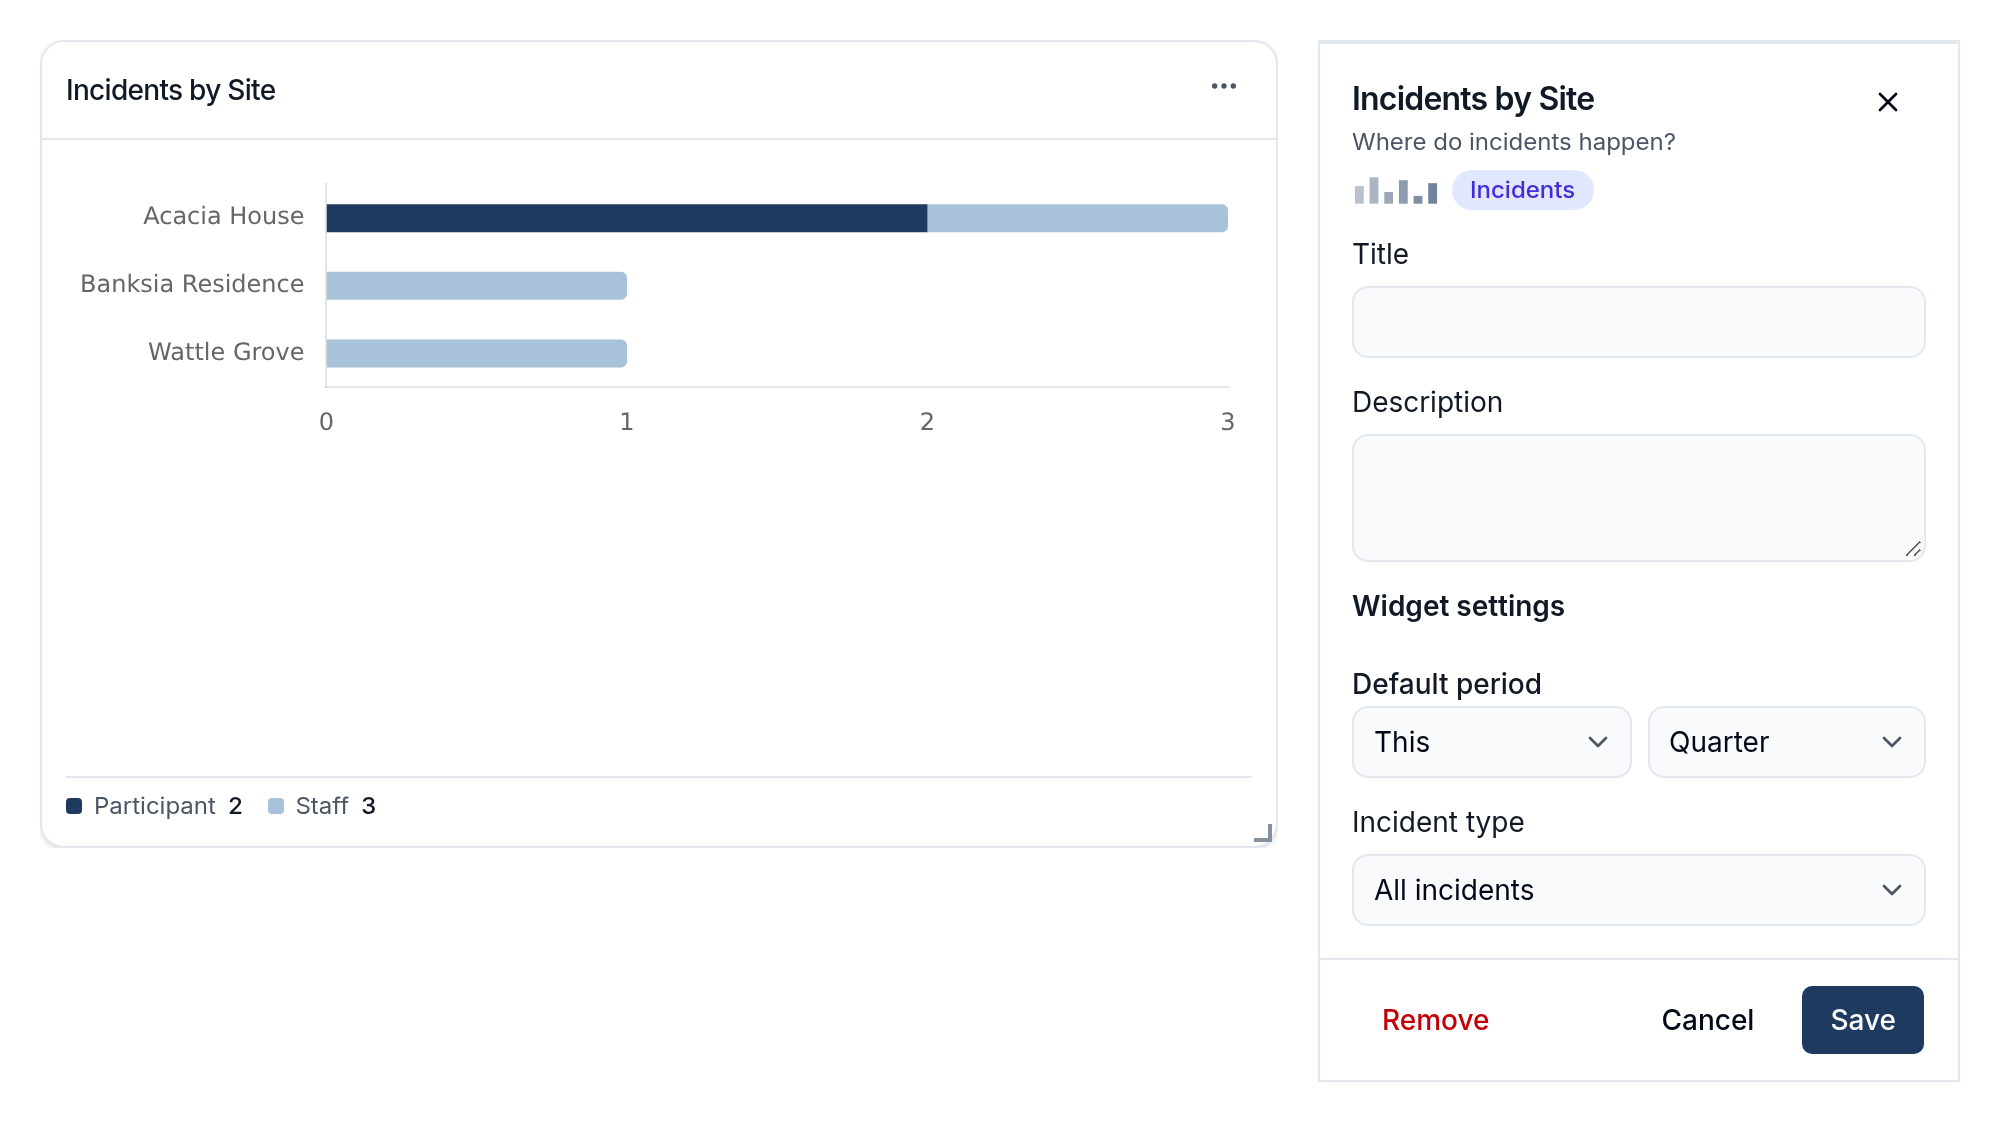
Incidents by Site
Shows the number of incidents at each site over the selected period, split into Participant and staff incidents. Incidents that aren't linked to a site aren't counted.
- Default period - this quarter by default.
- Incident type - All incidents, Participant incidents or Staff incidents.
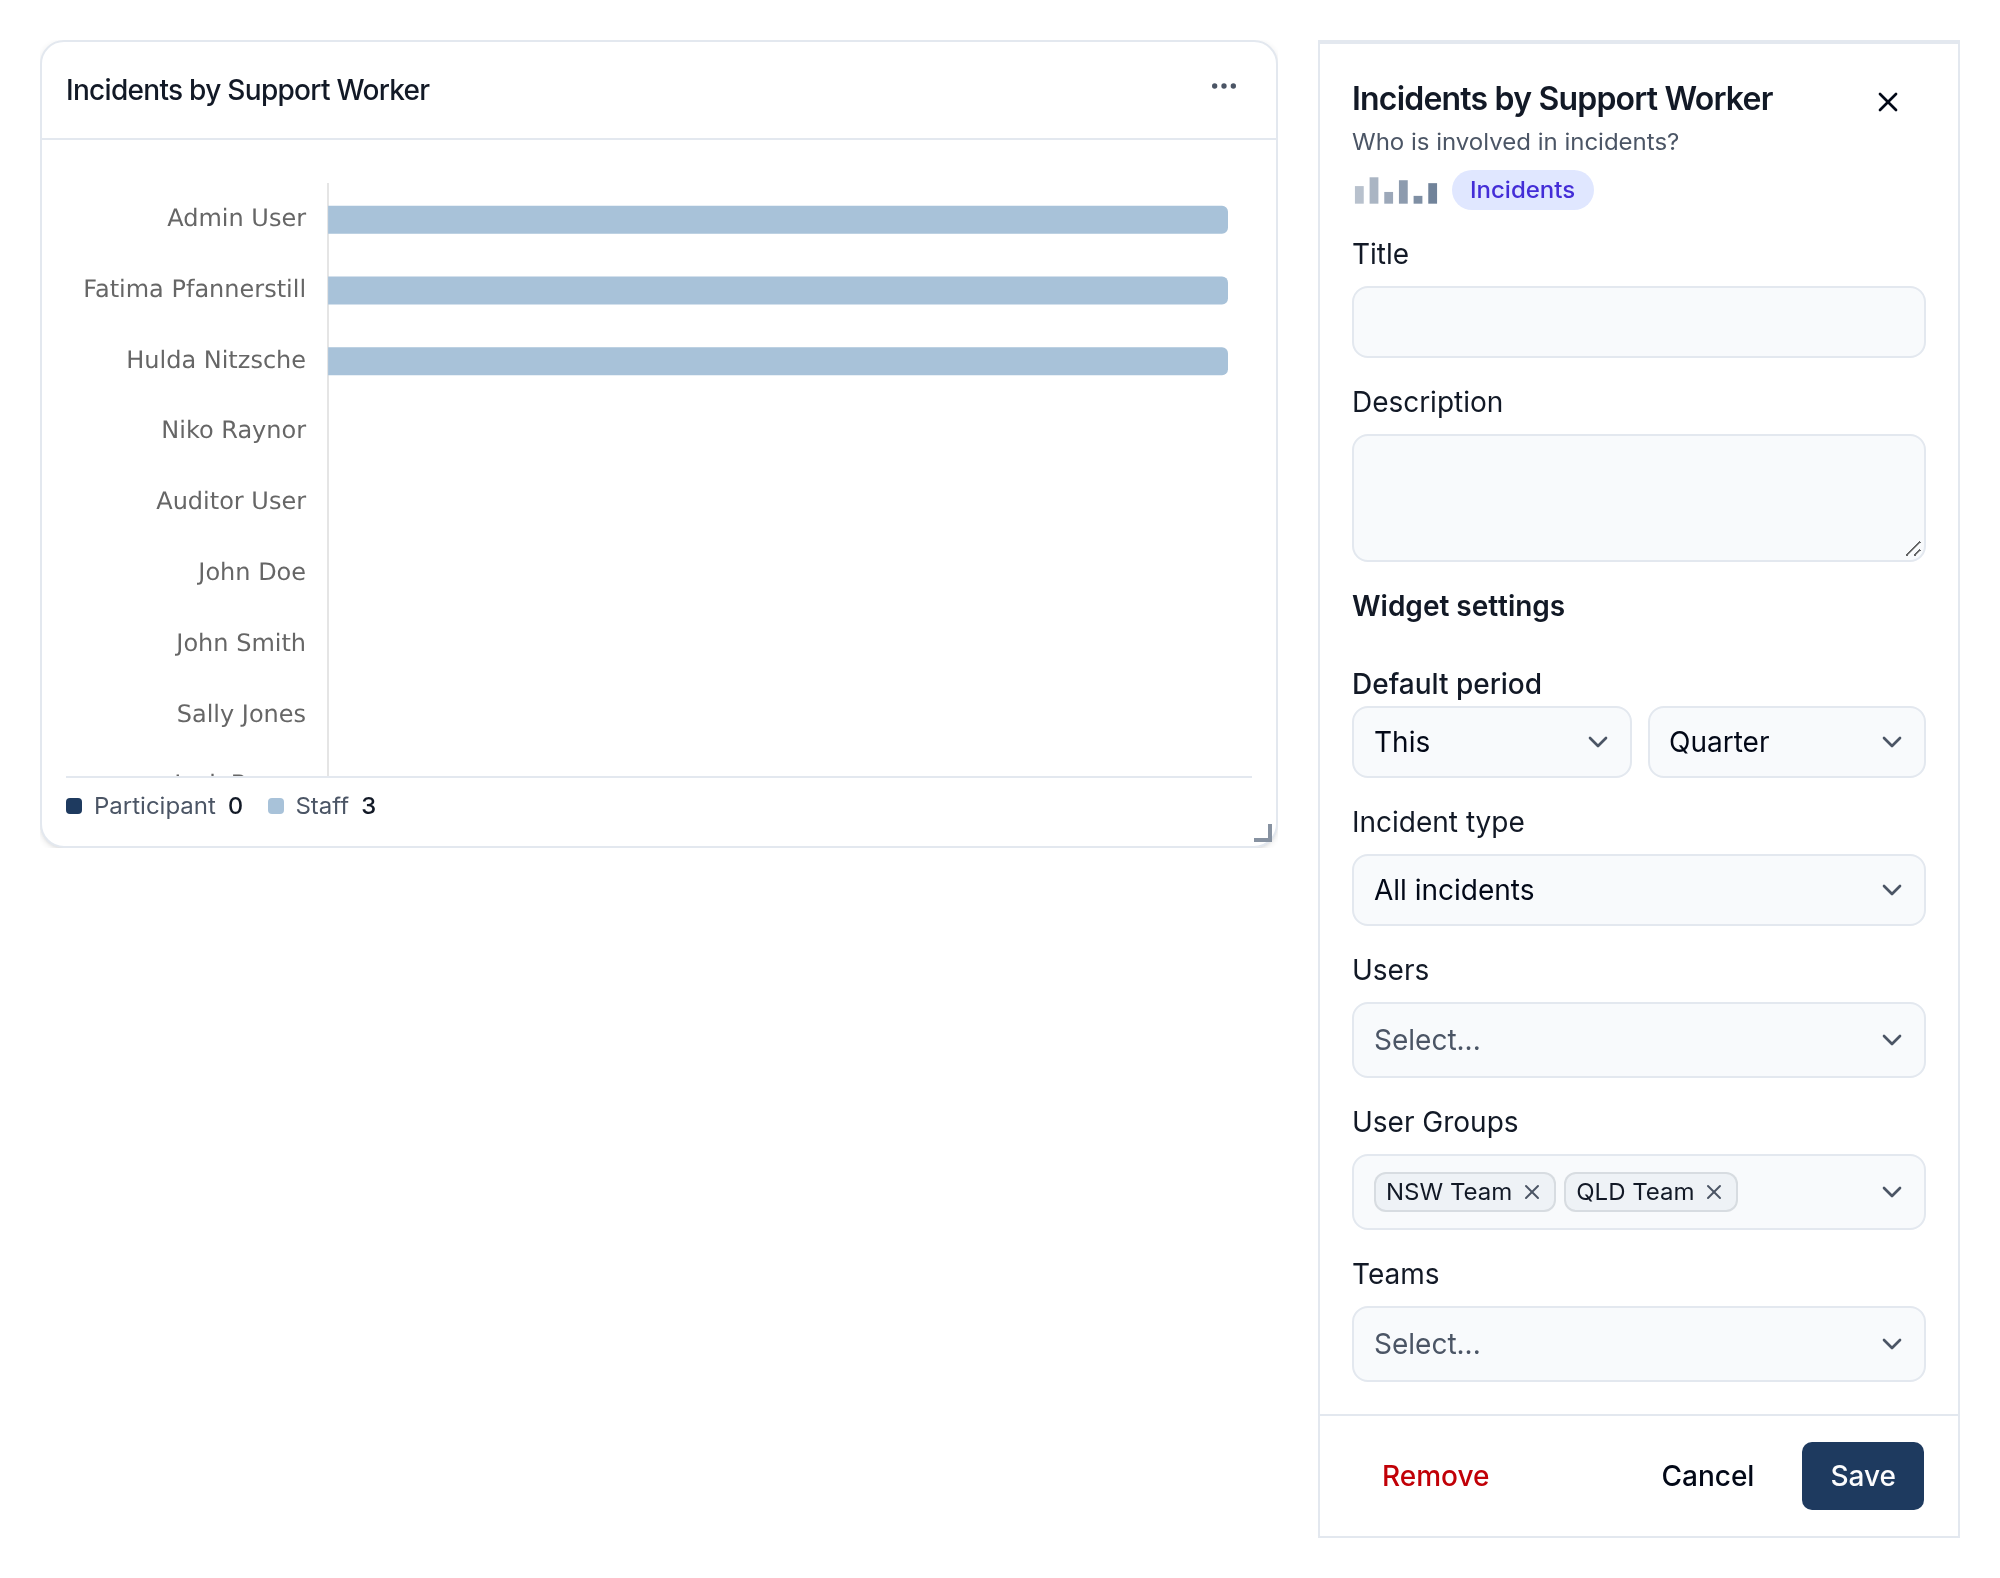
Incidents by Support Worker
Shows the number of incidents each worker was involved in over the selected period, split into Participant and staff incidents.
- Default period - this quarter by default.
- Incident type - All incidents, Participant incidents or Staff incidents.
- Users, User Groups and Teams - the workers to show.
Participant Dashboard Widgets
These widgets are only available on a Participant dashboard. Each one shows the Participant whose profile is open, with a link to the full list on their profile or in a report.
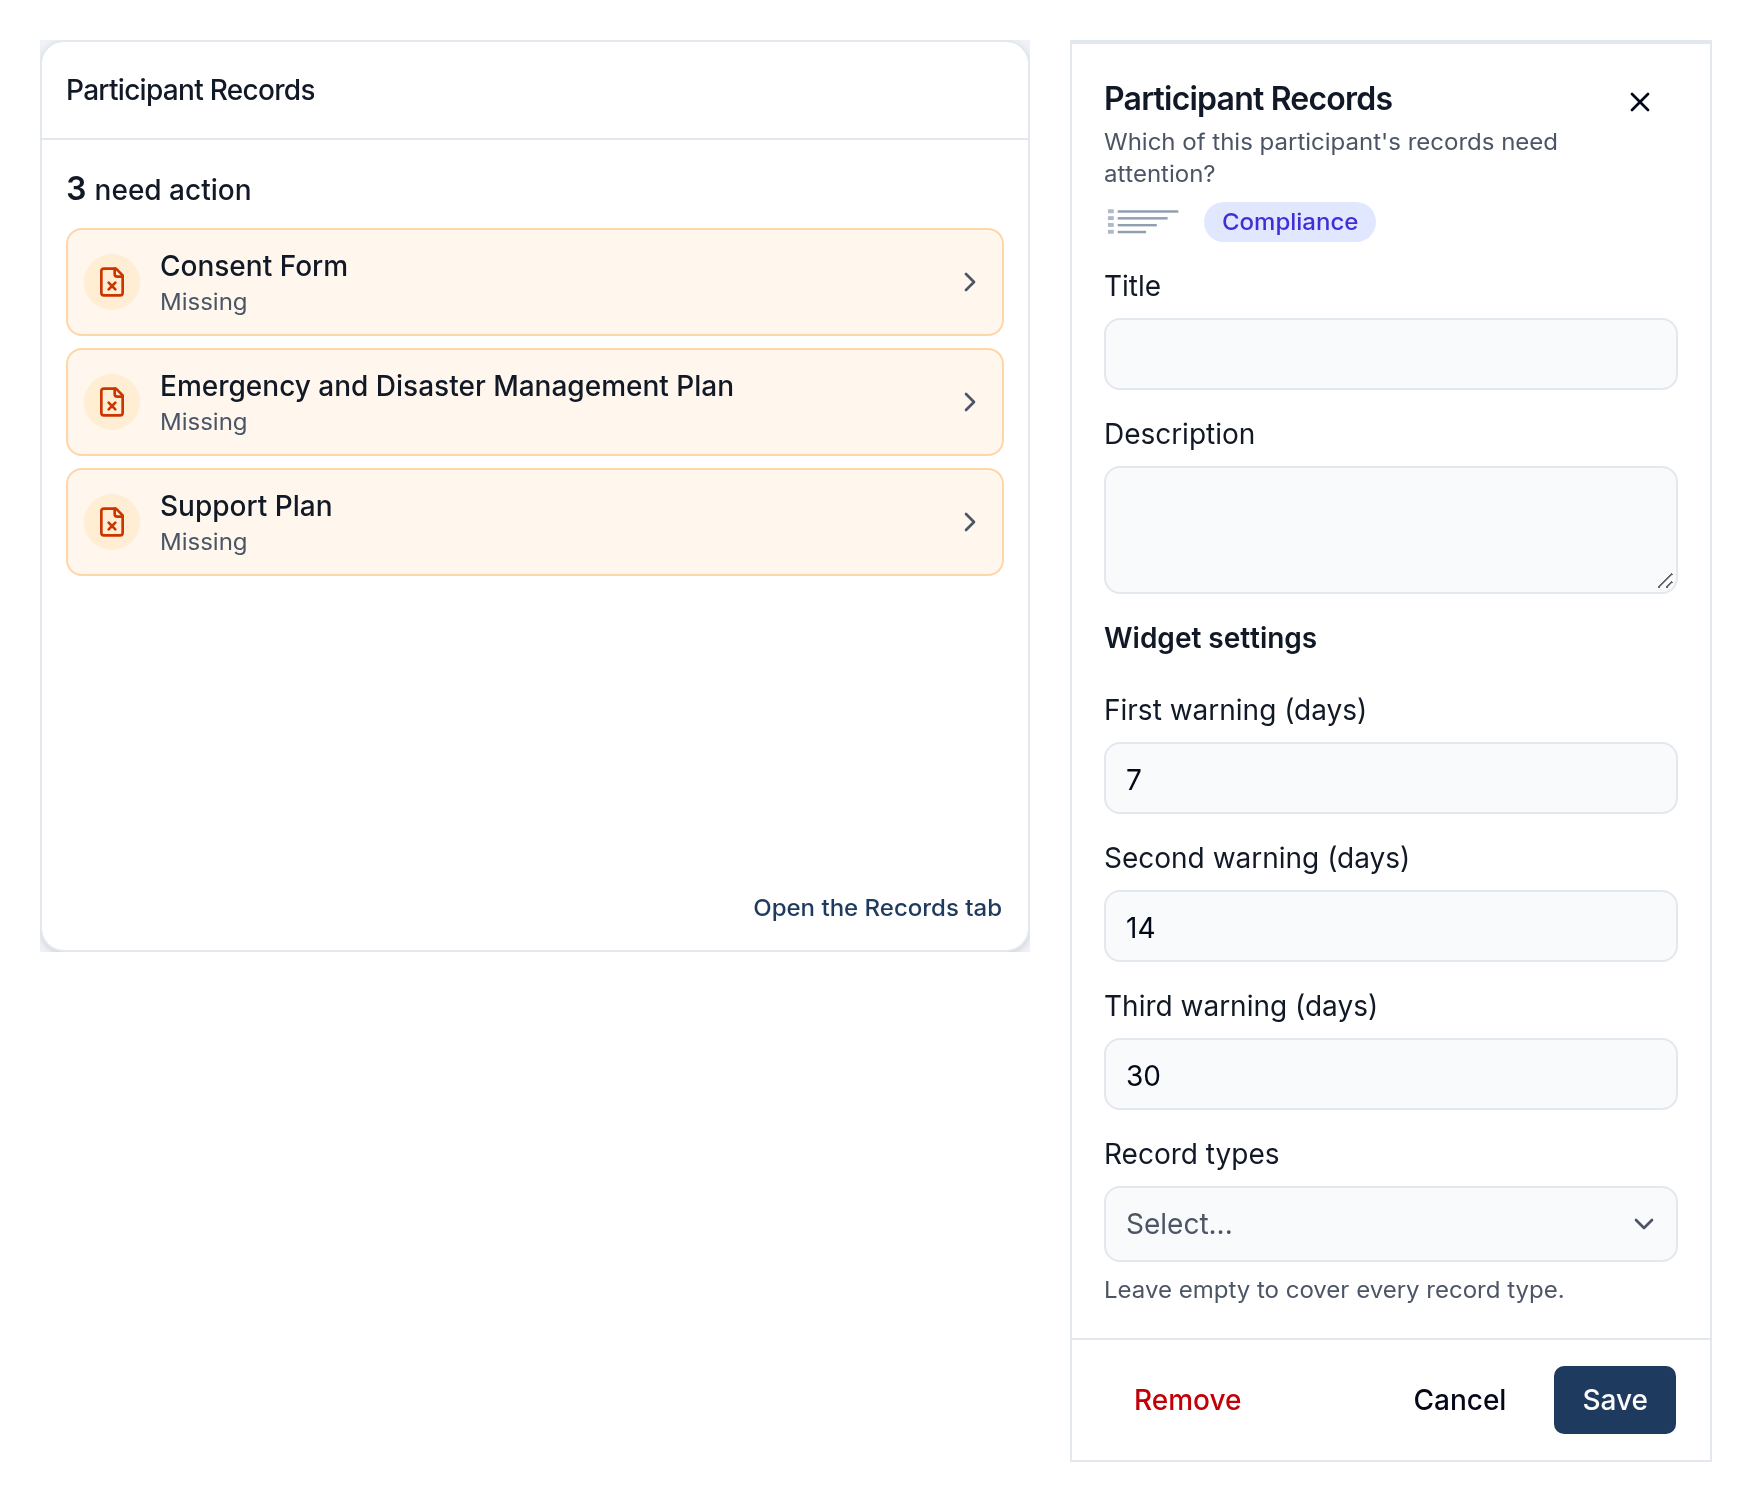
Participant Records
Lists the Participant's records, most urgent first, with anything missing, expired or expiring soon called out.
Its settings are the three warning windows and Record types.
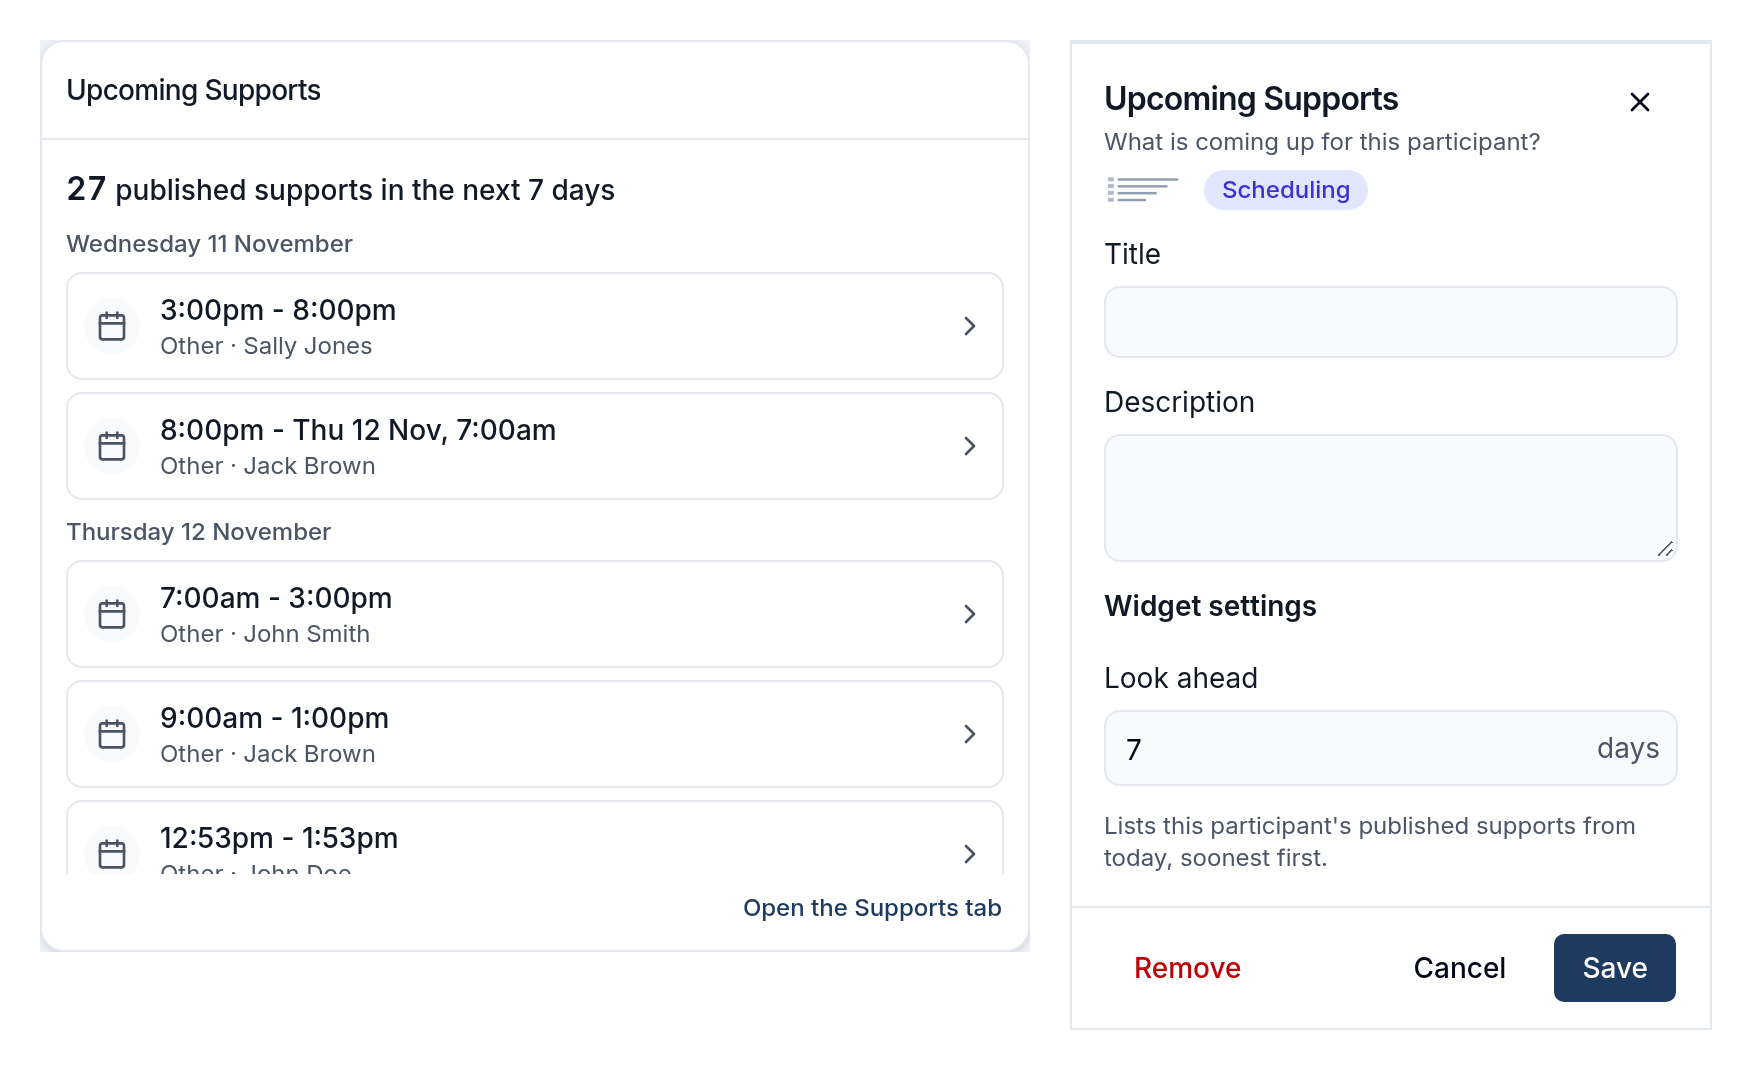
Upcoming Supports
Lists the Participant's published supports from today, soonest first, with who is working each one.
Set how many days to Look ahead, from 1 to 28 - 7 by default.
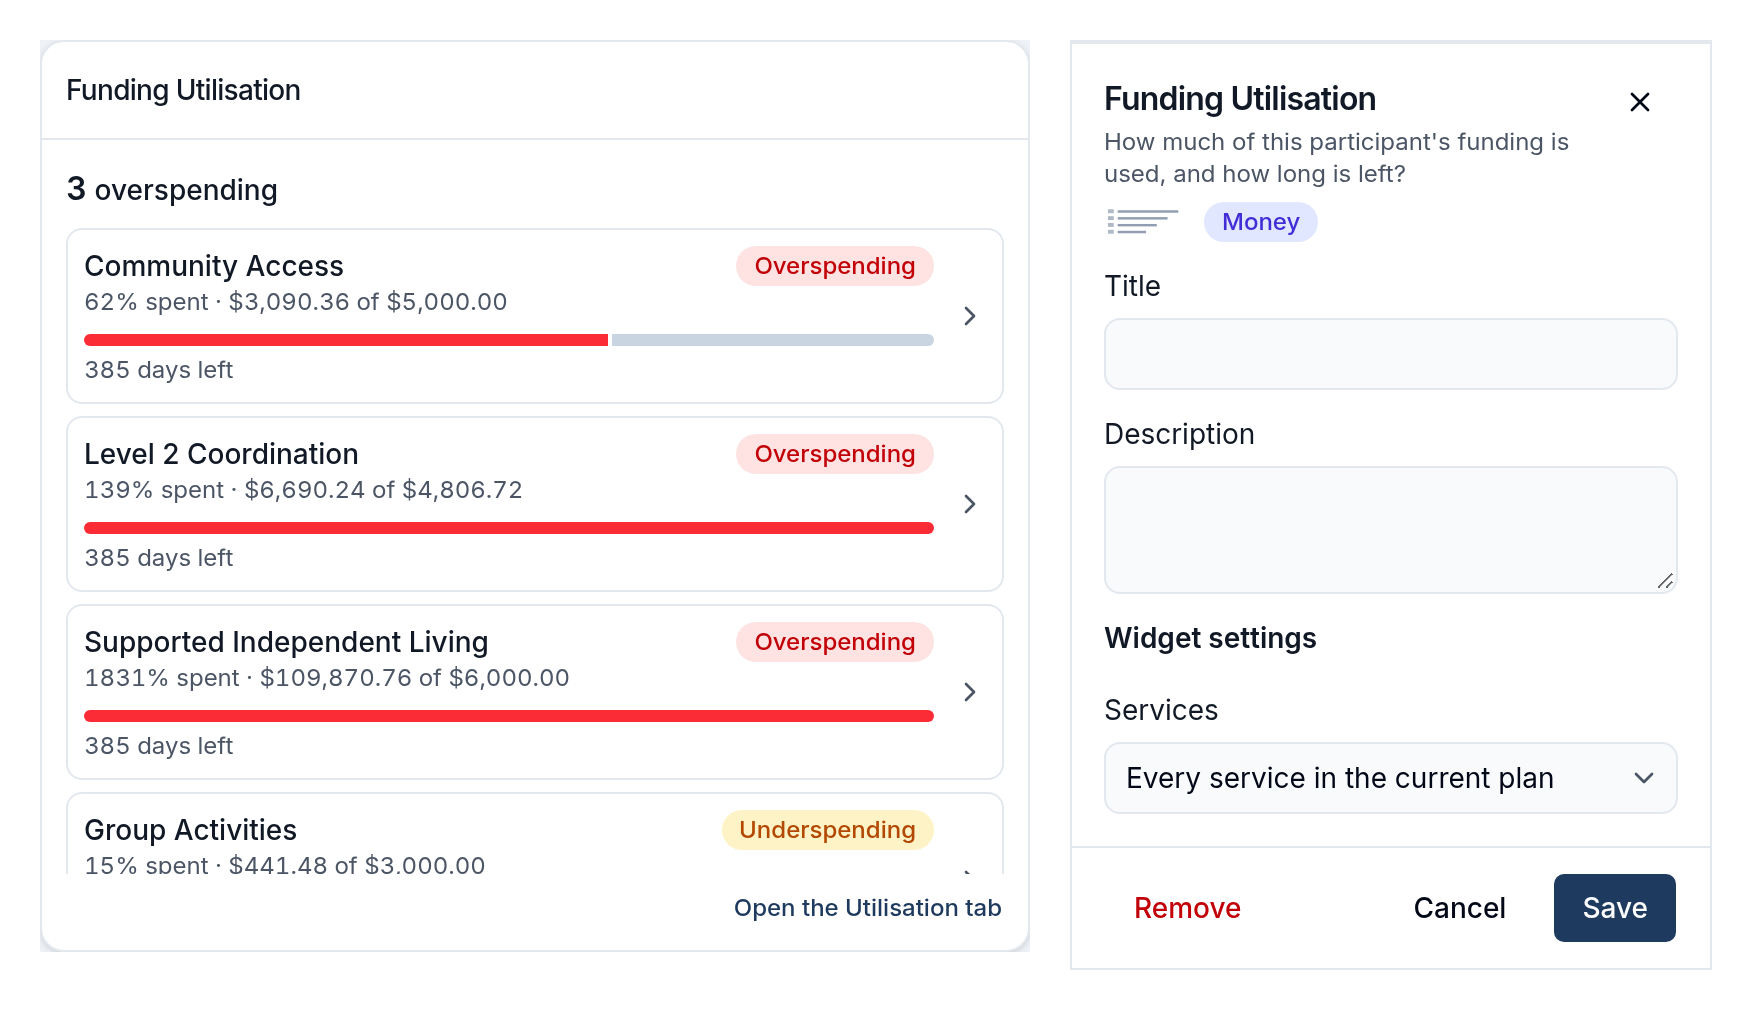
Funding Utilisation
Shows how much of each service in the Participant's current plan has been used and how many days are left, with overspending and underspending called out.
Choose which Services to show: Every service in the current plan or Only overspending services.
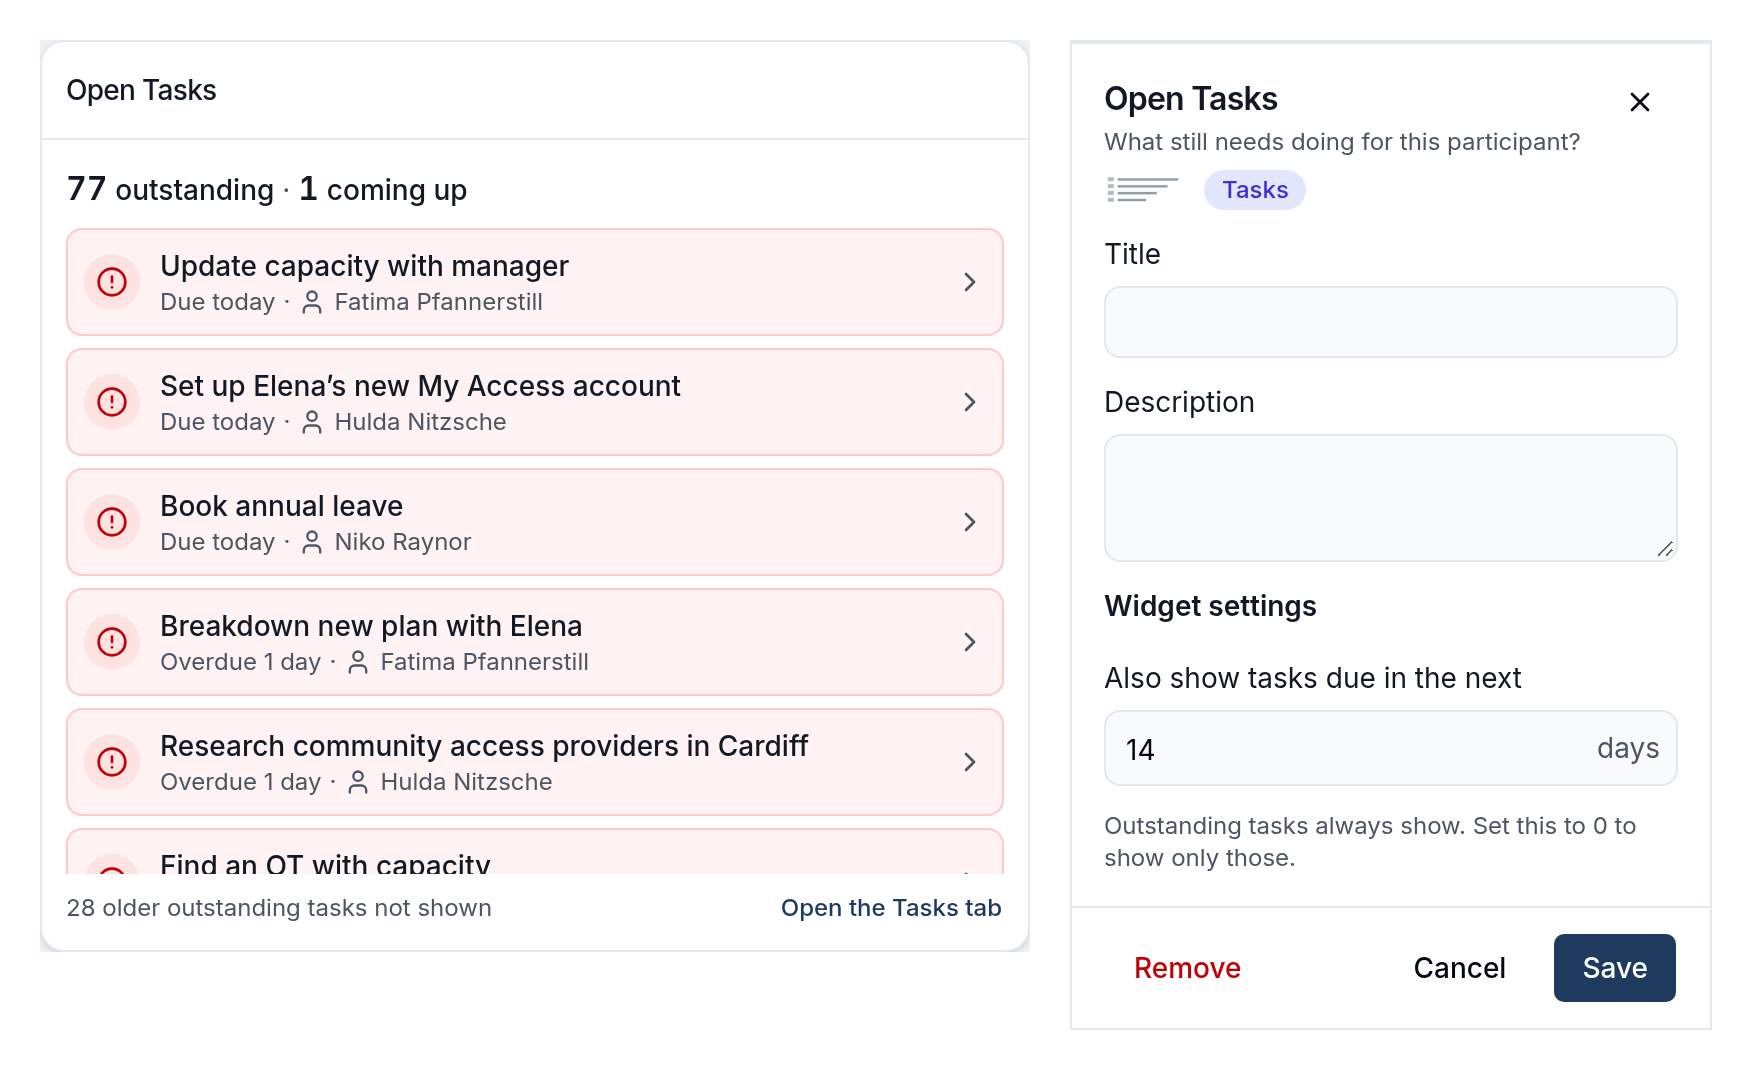
Open Tasks
Lists the Participant's tasks due today, then overdue tasks, then tasks coming up, with who owns each one.
Outstanding tasks always show. Also show tasks due in the next sets how many days of upcoming tasks to add - 14 by default, or 0 to show only outstanding tasks.
Missing Case Notes
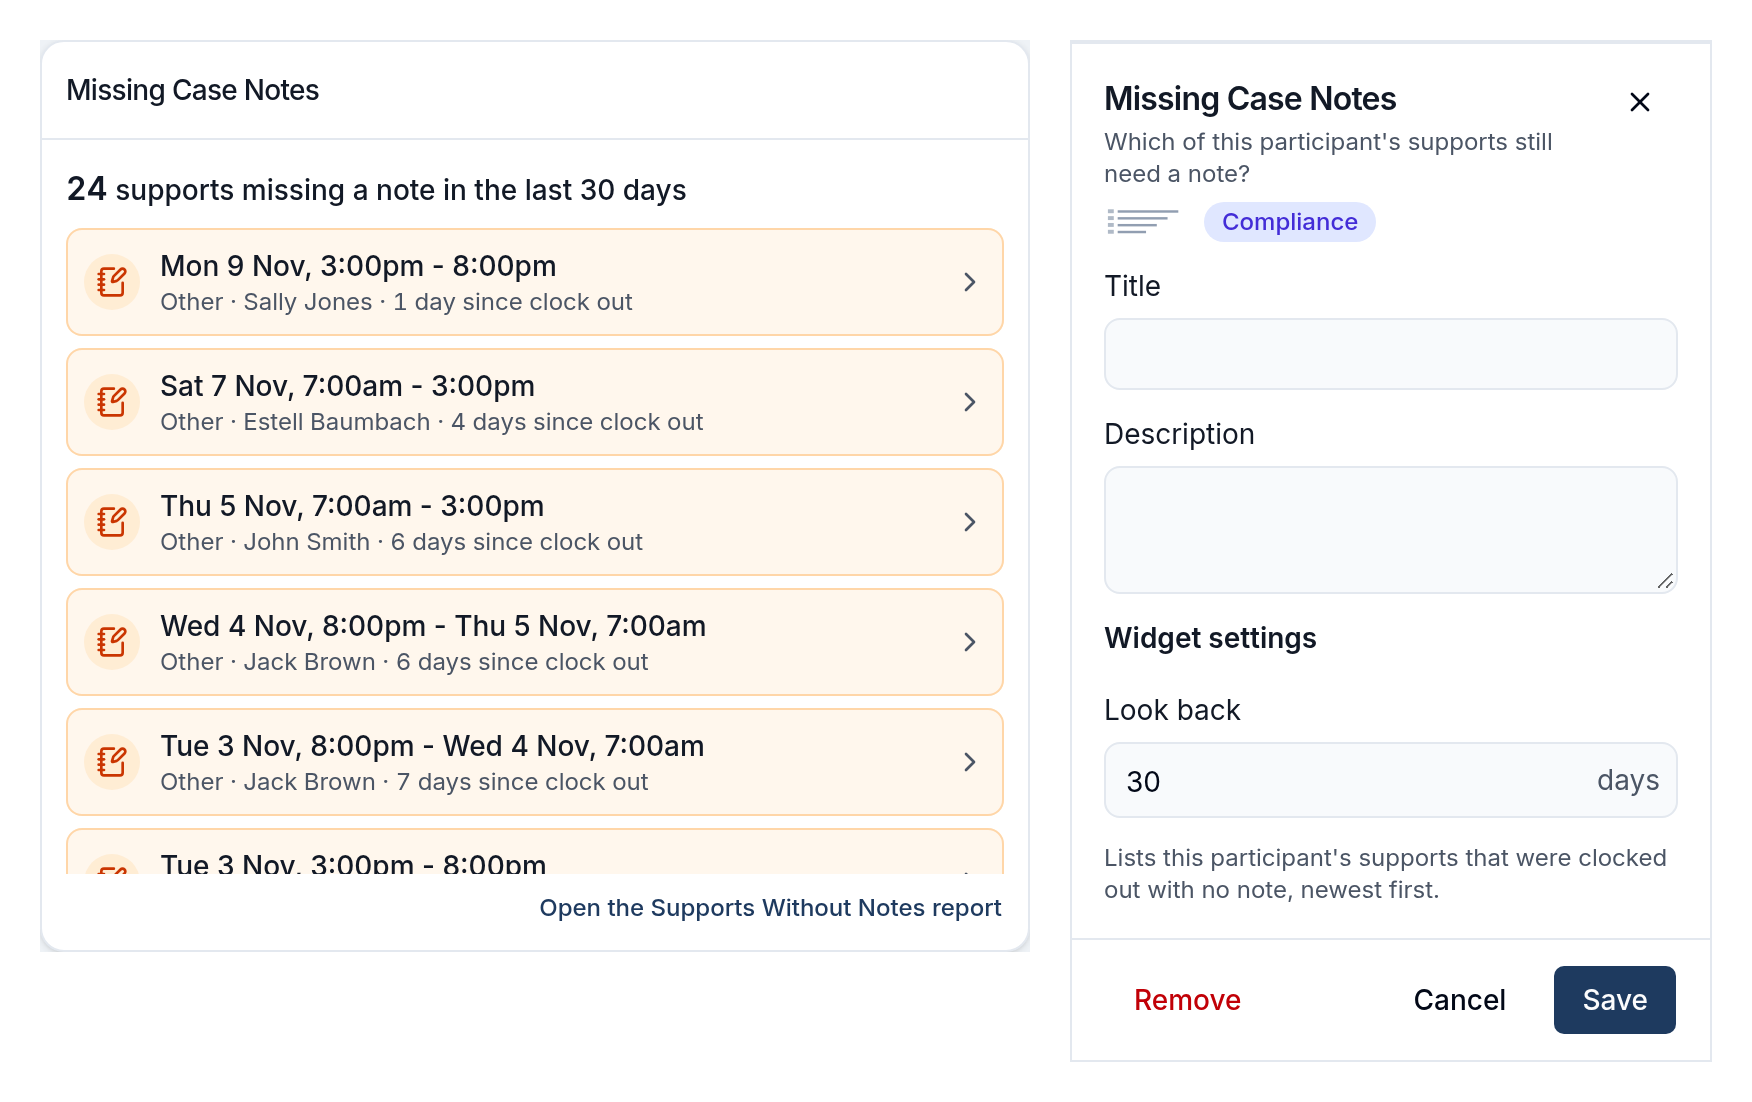
Lists the Participant's supports that were clocked out with no case note, newest first, with who worked each one.
Set how many days to Look back, from 1 to 90 - 30 by default.