- Scheduling
- Scheduling Costs
Scheduling Costs
Scheduling Costs estimates the wage cost of your roster before payroll runs. It uses the award on each worker's employment contract to calculate gross wages, allowances, super, and on-costs, then compares that cost with the revenue from those shifts.
The optional Scheduling Costs feature must be enabled. Opening the report also needs Finance access and Can manage Scheduling Costs. The Account Owner always has the toggle. For other Admins it is off by default and is turned on from their Permissions tab. Managers cannot be given it.
The figures are estimates based on your rostered shifts and configured rates, and may differ from what actually gets paid through payroll.
The supported awards are SCHADS, Nurses, Aged Care and Health Professionals. Each award page lists the implemented rules and the cases that need manual review.
Check Rates Before Relying on Costs
Costing uses the worker's Astalty base rate and loaded allowance schedules. Xero uses its own mapped pay items and employee template, so a pay group override or an out-of-date rate can make payroll differ from this estimate. See Maintaining Award Rates.
The free-standing date-range cost view does not load adjoining work from the previous pay period. A timesheet-batch interpretation does. Review continuous work at the start of a custom range, missing employees, and manual entitlements described on the award pages before relying on an estimate.
Temporary Vehicle Rate
For workers whose contract award is SCHADS or Aged Care, Astalty costs eligible vehicle travel at $1.05/km from the first full pay period starting on or after 1 September 2026, for travel through 28 February 2027. Travel from 1 March 2027 returns to $1.01/km, even when the pay period straddles that date. The temporary increase does not apply to earlier-starting pay periods or to Nurses and Health Professionals.
This rate follows the worker's contract award, not a shift's pay group override. Payroll exports send kilometres, not the dollar allowance: set the payroll kilometre item to the applicable rate yourself, then change it back when the temporary period ends. A correct cost estimate does not update Xero's pay-item rate.
Enabling Scheduling Costs
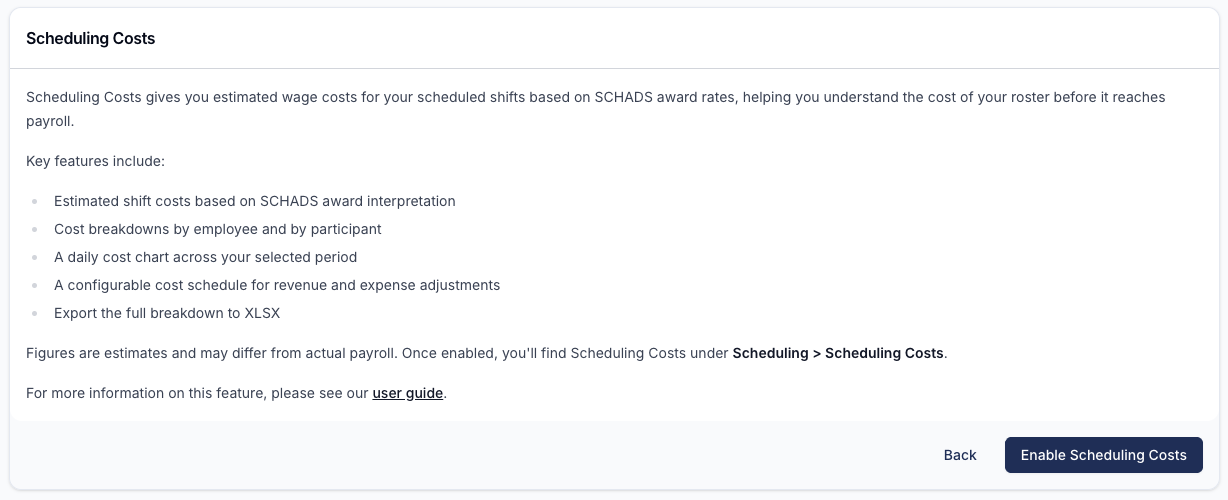
Scheduling Costs is a self-service optional feature. Only the Account Owner can turn it on or off, and there are two places to do it:
- From the Scheduling menu. Until it's enabled, Account Owners still see Scheduling Costs in the Scheduling menu; selecting it opens a page that explains the feature and lets you enable it.
- From Optional Features. Go to Optional Features (Settings > Optional Features) and select Enable on the Scheduling Costs card.
Either way you'll land on the Scheduling Costs feature page - select Enable Scheduling Costs and confirm.
Opening the Report
Scheduling Costs lives in the Process section of the Scheduling menu, alongside Timesheet Batches.
The report is built from four parts:
- Filters - narrow the report by Period (the date range), Site, Timesheet Batch, Cost Code, Activity, Revenue Charge Status, Shift Status, Archived Participants, Deactivated Employees, and Exclude Employees. A Direct Charges filter also appears if your organisation uses direct charges. The report defaults to the current week.
- Summary figures - cards showing the cost and revenue totals for the filtered period, grouped into Key figures, Cost breakdown, Revenue breakdown, and Workforce & cancellations.
- Daily cost chart - a day-by-day view of cost and revenue across the period, underneath the summary figures. See The Daily Cost Chart.
- Breakdown tabs - Cost by Employee, Cost by Participant, and Cost by Region tabs, so you can see where the cost and revenue are coming from. See Breakdown Tabs.
The Actions menu (top right) lets you Manage Cost Schedule and Export as XLSX.
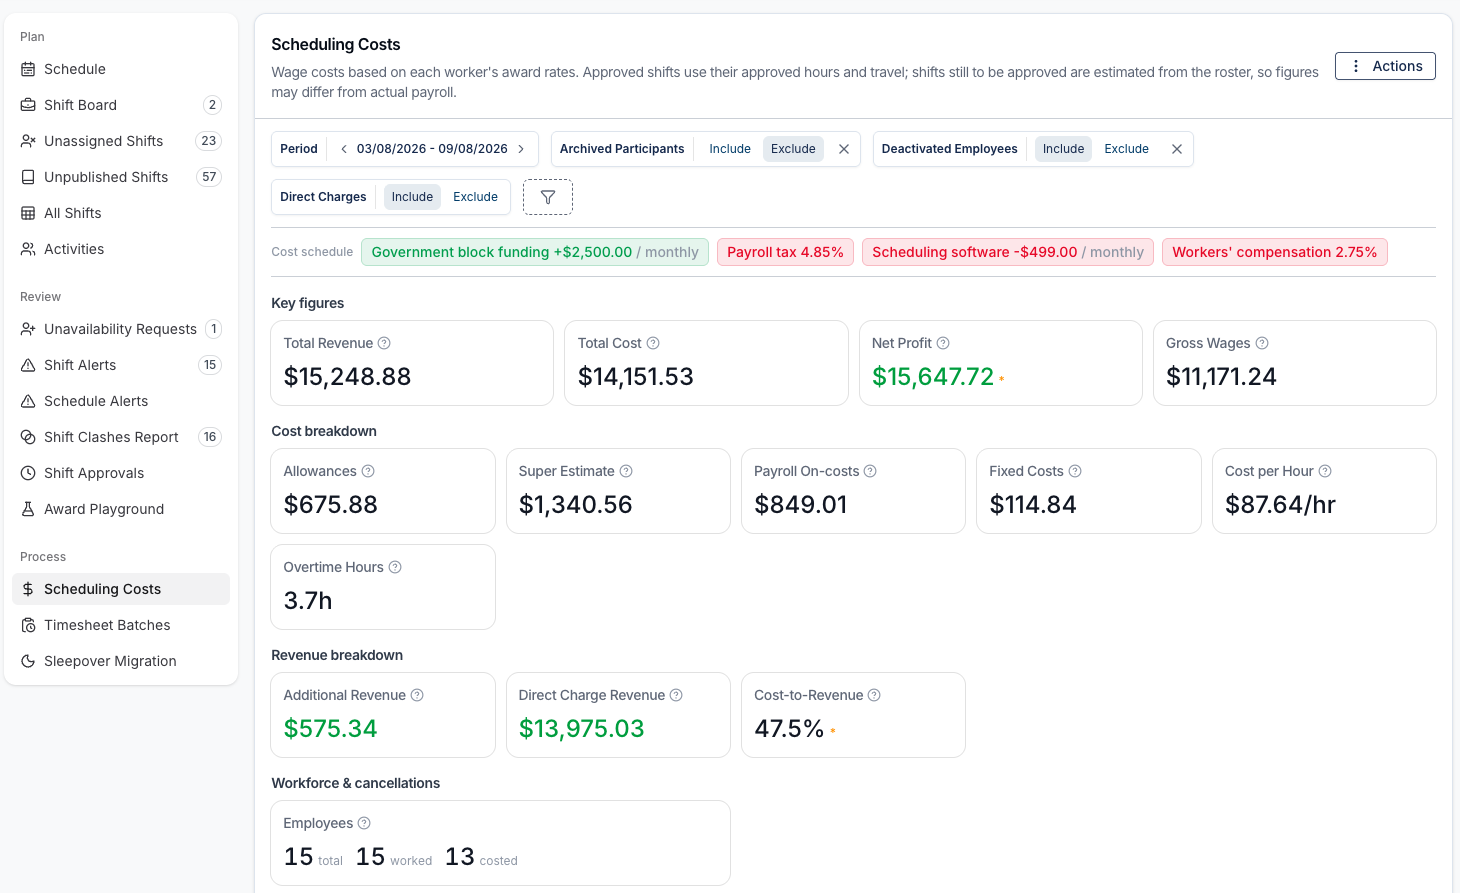
Three filters control who and what is counted:
- Archived Participants - the report excludes archived Participants by default. Switch this filter to Include to bring their supports back into the figures.
- Deactivated Employees - the report includes deactivated employees by default, so a report you ran before this filter existed still shows the same figures. Switch to Exclude to see what your current team costs. Employees with restricted access still count as current employees.
- Direct Charges - controls whether direct charge revenue is counted. It's included by default, but is switched off automatically while a Cost Code or Activity filter is active, because direct charges aren't linked to either.
Filters apply to the summary figures, daily cost chart, breakdown tabs and XLSX export, with one exception: Cost by Region and the workbook's Region Detail sheet ignore the Region filter so you can compare regions. They still follow the other report filters.
Excluding Specific Employees
Exclude Employees leaves named staff out of the cost figures without deactivating them - useful for office staff, trainees, or anyone whose shifts the report was never meant to measure.
The filter isn't on the bar by default. Select the filter button at the end of the filter bar, choose Exclude Employees, then tick one or more names. The list covers every employee who has ever been rostered a shift, with Deactivated, Restricted or Invited shown against the name.
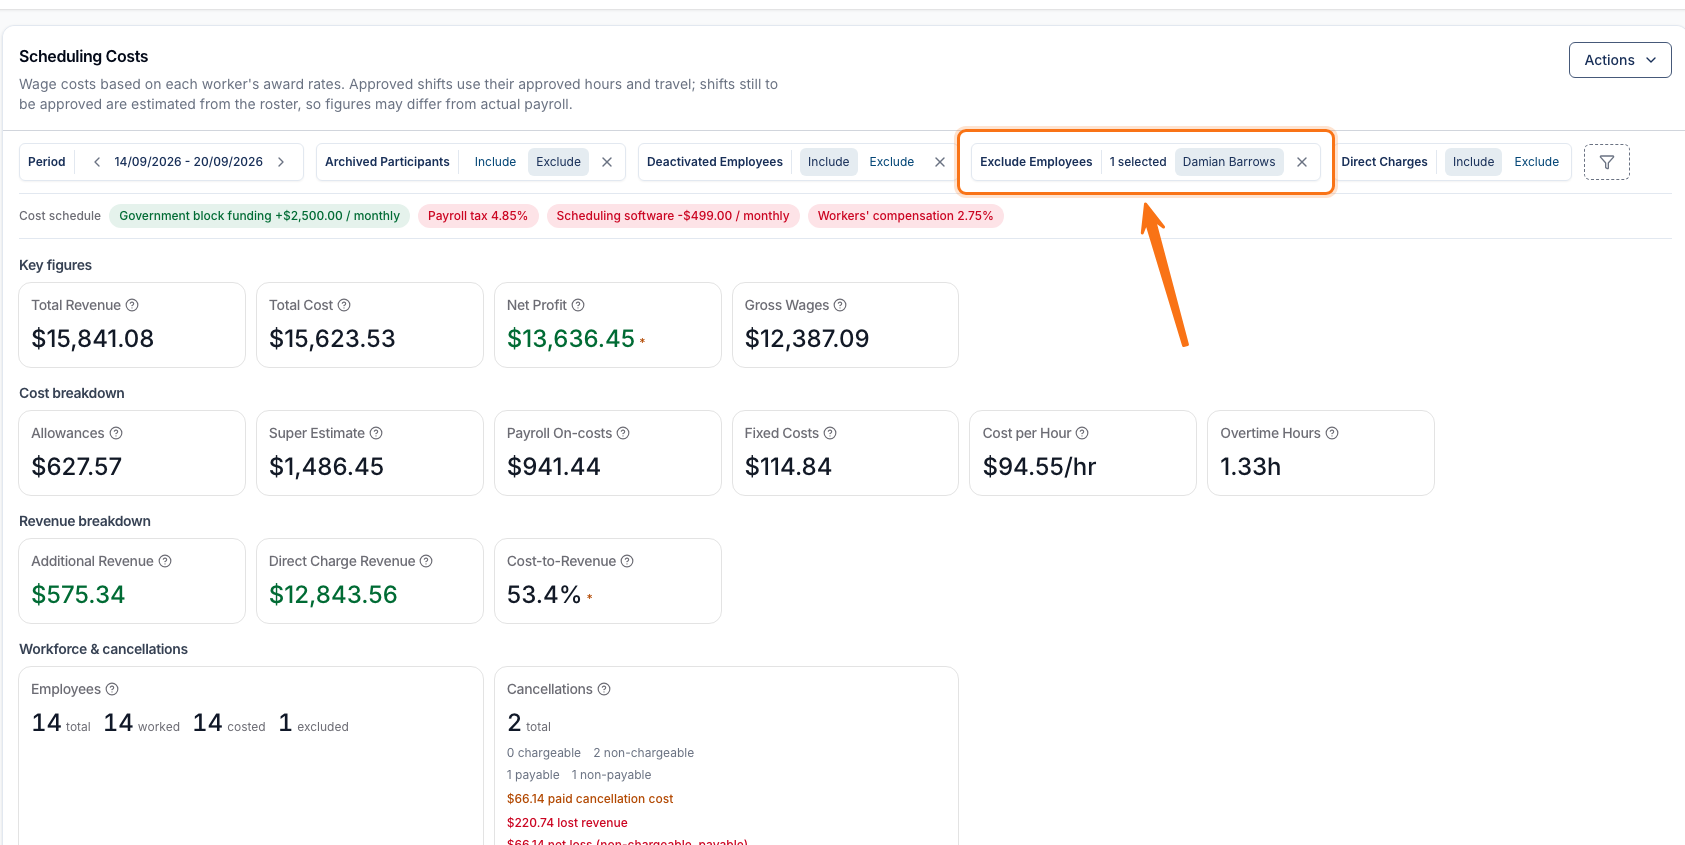
Excluding an employee takes their hours, wages, allowances, super, on-costs, overtime, and paid cancellation costs out of every figure on the report - the summary cards, the daily cost chart, all three breakdown tabs, and the XLSX export. They drop out of Cost by Employee entirely rather than showing as a zero row, their cost comes off each Participant they supported on Cost by Participant and each region that work belongs to on Cost by Region, and their cancelled supports leave the Cancellations card. Revenue is the exception: the income those shifts earned still counts toward Total Revenue, which is what the amber asterisk on Net Profit and Cost-to-Revenue is flagging.
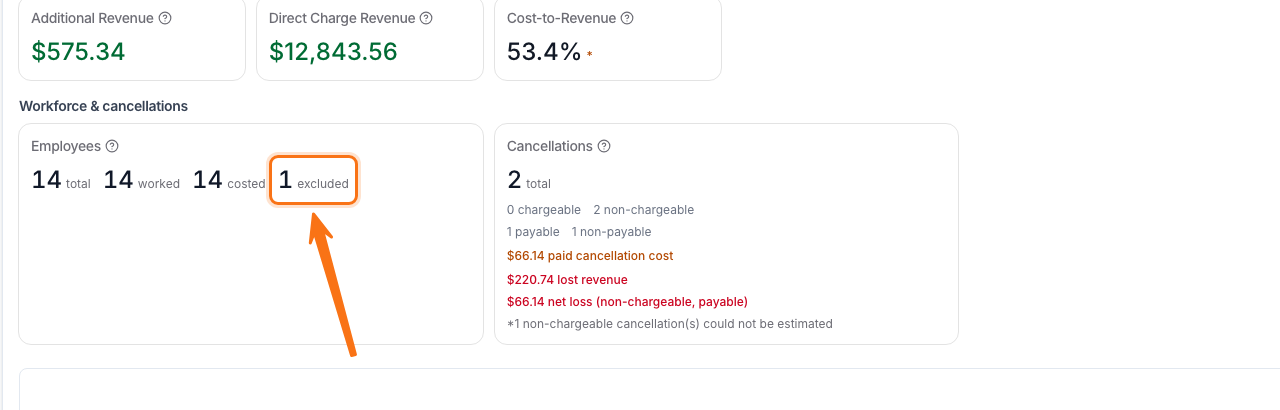
The Employees card shows how many were left out. That count is how many of the employees you ticked actually had shifts matching your current filters, so ticking someone who didn't work in the period changes nothing.
Understanding the Figures
The summary figures are grouped into four sections - Key figures, Cost breakdown, Revenue breakdown, and Workforce & cancellations - with the numbers you're most likely to want pinned at the top. Each card has a hover tooltip explaining how it's calculated. Cards only appear when they're relevant - for example, Fixed Costs only shows once you've added a fixed-amount cost item, and the whole Revenue breakdown section is hidden when there's no revenue in the period.
Key Figures
- Total Revenue - all scheduled Charge Items for Participants in the period, based on their service agreements.
- Total Cost - gross wages, allowances, super, on-costs, fixed costs, and paid cancellation costs for every costed employee in the period.
- Net Profit - total revenue and additional revenue minus total cost. Positive figures show as green (profit) and negative figures as red (a loss).
- Gross Wages - base wages from each employee's hourly rate and hours worked, including penalty rate loadings.
Cost Breakdown
What sits behind Total Cost, plus the hourly and overtime figures for the period:
- Allowances - award allowances such as vehicle kilometre, first aid, broken shift, sleepover, and laundry.
- Super Estimate - estimated superannuation based on gross wages and the current statutory super rate.
- Payroll On-costs - percentage-based cost items (e.g. payroll tax, workers' comp) applied to wages, as set in your cost schedule.
- Fixed Costs - fixed-amount cost items (e.g. rent, insurance) normalised to the reporting period.
- Cost per Hour - average cost per hour worked (excluding paid cancellation costs).
- Overtime Hours - total hours across the filtered period that attract an overtime rate. Your award decides which hours those are - most commonly hours beyond an employee's ordinary hours cap, but other rules apply too. This card only appears when there is overtime in the period. See Seeing Total Overtime Hours.
Revenue Breakdown
- Additional Revenue - revenue-coded cost items (e.g. Participant rent contributions) normalised to the reporting period, from your cost schedule or a site. See Tracking Additional Revenue below.
- Direct Charge Revenue - direct charges billed to Participants in the period that aren't linked to a scheduled support. This includes projected upcoming recurring direct charges that haven't been created yet, so the figure reflects the revenue you expect for the period. It counts toward Net Profit and Cost-to-Revenue, and only appears when there are direct charges in the period.
- Cost-to-Revenue - total cost (including cancellations) as a percentage of total revenue plus any additional revenue. Lower is better; under 100% means revenue exceeds cost.
Workforce & Cancellations
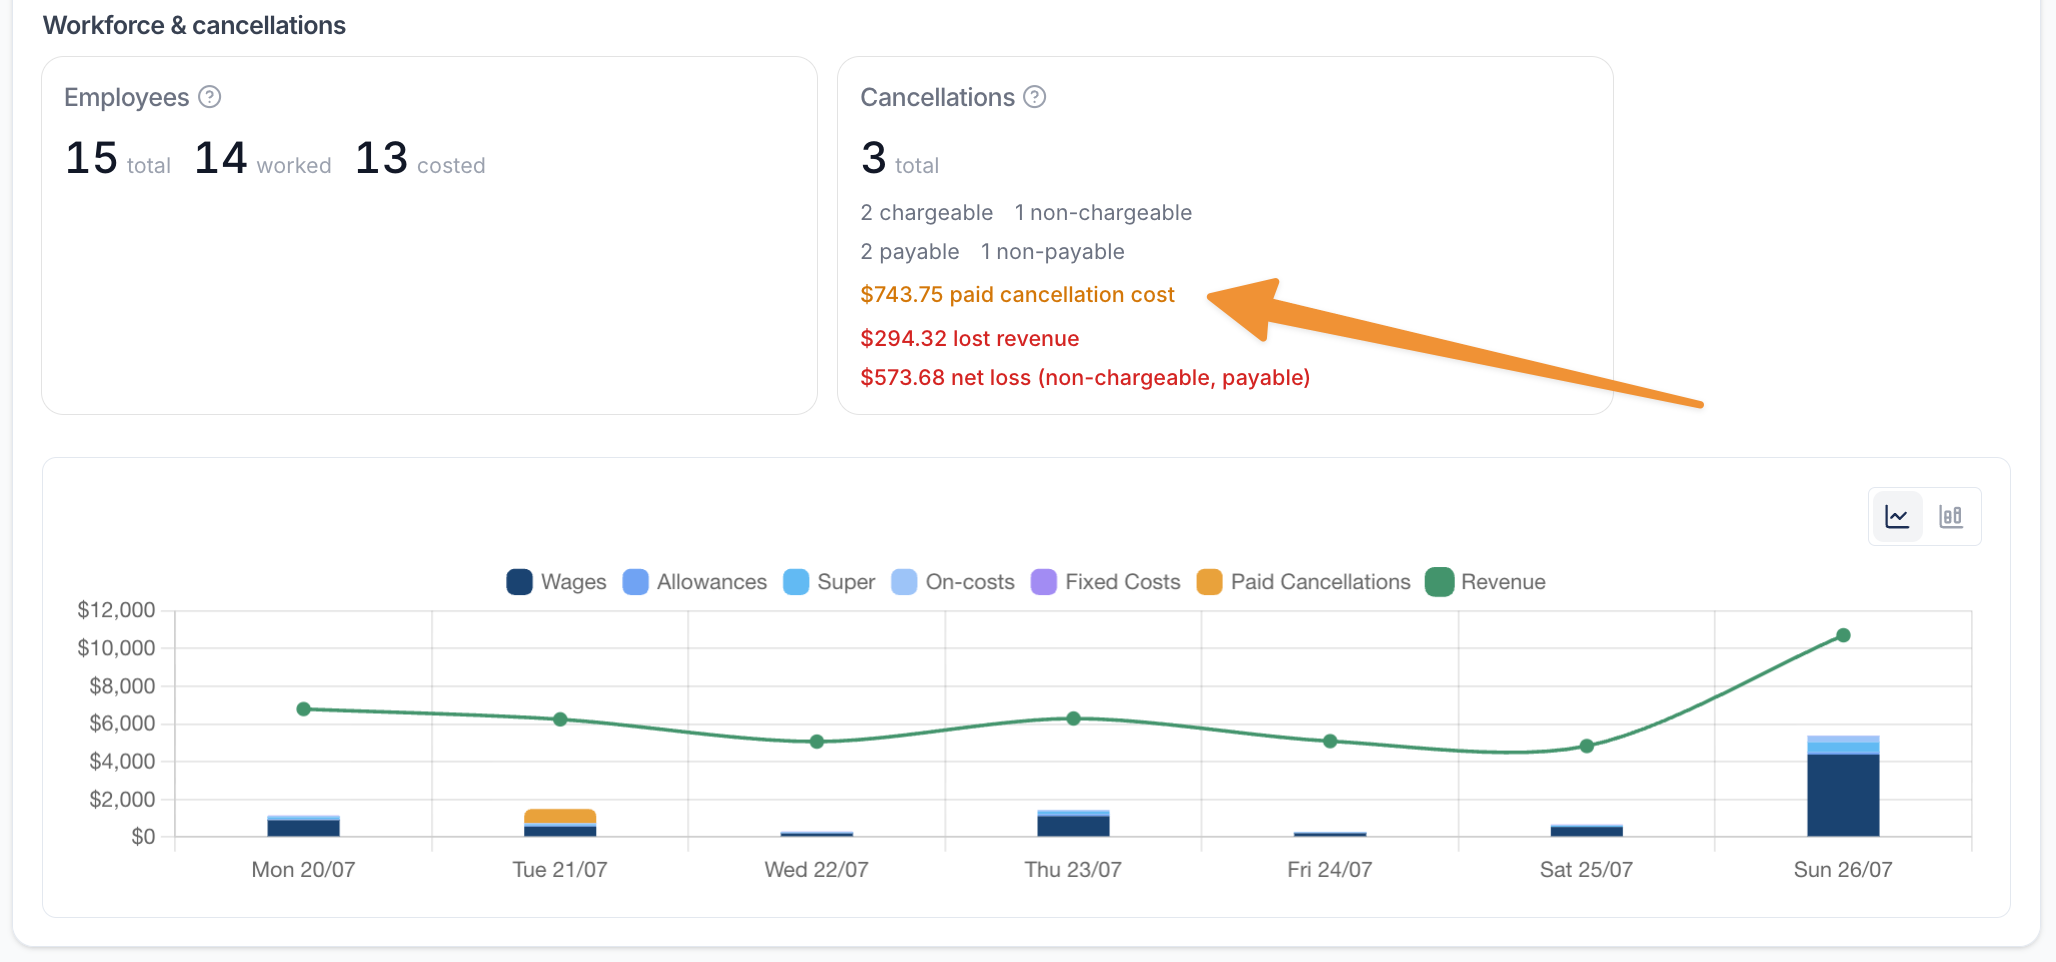
- Employees - how many active rosterable employees you have, how many had shifts, how many could be costed, and how many the Exclude Employees filter left out.
- Cancellations - cancelled supports in the period, broken down by whether the Participant is still charged (chargeable / non-chargeable) and whether the employee is still paid (payable / non-payable). This card only appears when there are cancellations in the period.
Three figures on the Cancellations card highlight the financial impact:
- Paid Cancellation Cost - estimated wages, super, and on-costs paid to workers for cancelled shifts they're still entitled to be paid for. This is money paid out regardless of whether the Participant was charged.
- Lost Revenue - the estimated revenue that would have been billed for cancelled supports marked not chargeable - income the organisation can no longer claim.
- Net Loss - the pay cost for cancelled supports that are not chargeable but still payable - wages paid out with no revenue earned, for example a rostering error under the award.
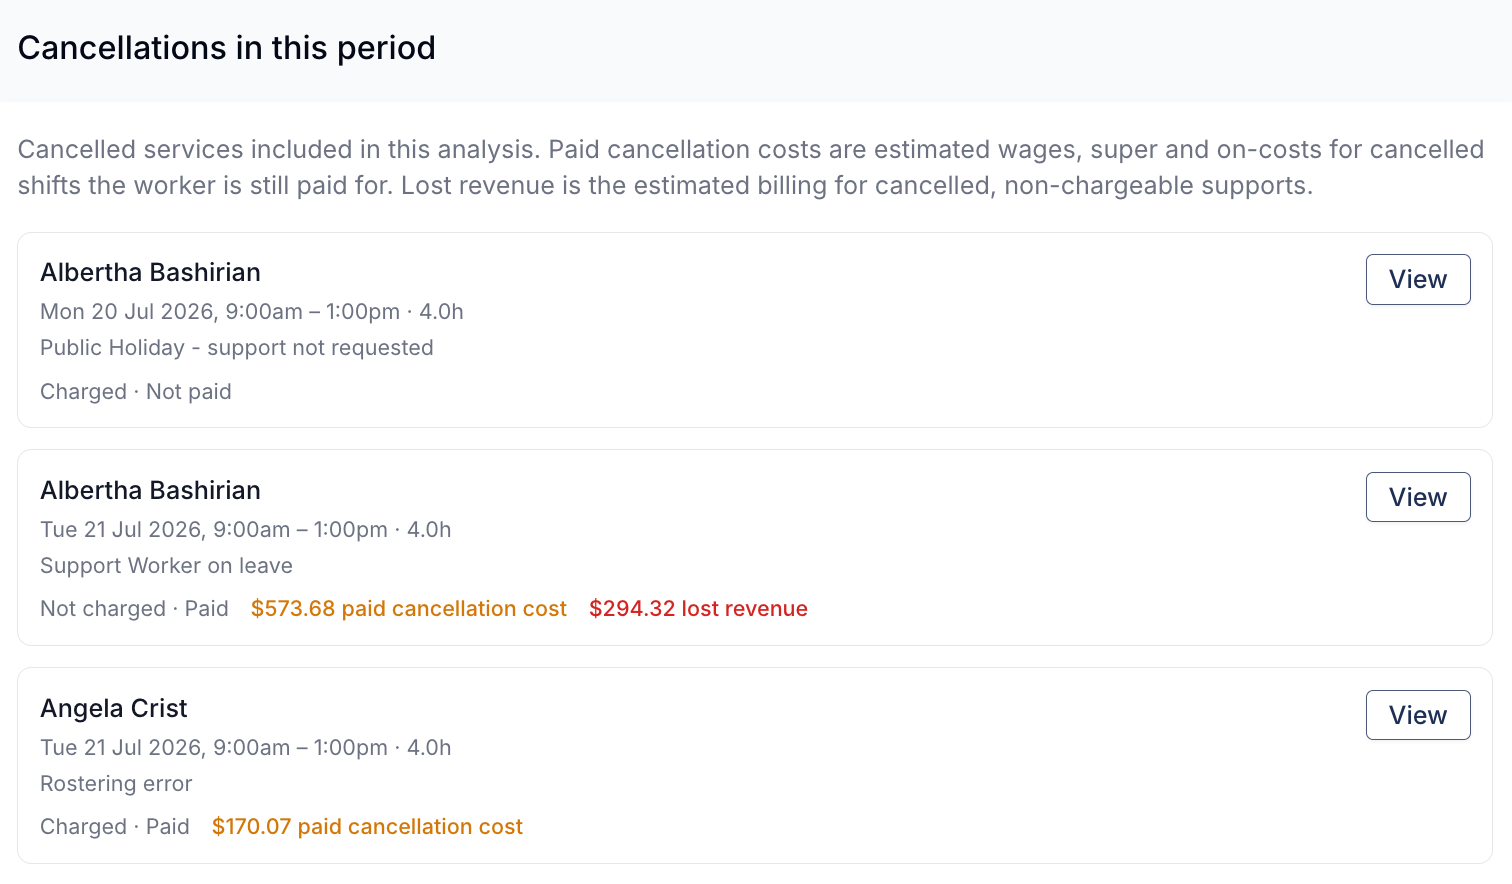
Select the Paid Cancellation Cost figure to open Cancellations in this period - a list of every cancelled service behind the total. Each row shows the Participant, the date and time, the hours, the cancellation reason, and its charge and pay treatment, along with the paid cancellation cost and any lost revenue. Select View on a row to open the related support.
The Daily Cost Chart
Underneath the summary, a chart plots the period day by day. Each day's bar stacks the cost that day - Wages, Allowances, Super, On-costs, Fixed Costs, and Paid Cancellations - with bands appearing only where there's a figure for them. Revenue is drawn over the top as a line; use the two icons above the chart to switch it between a line overlay and its own bar alongside the cost stack.
Hover a day to see its full breakdown: each cost component, the day's Total Cost, its Revenue (with Direct Charges listed separately where you have them), and the Net figure for the day in green or red.
Breakdown Tabs
Below the summary and the daily chart, three tabs show where the cost and revenue are coming from. They follow the filters at the top, except that Cost by Region ignores the Region filter. Astalty remembers whichever tab you last had open.
Cost by Employee
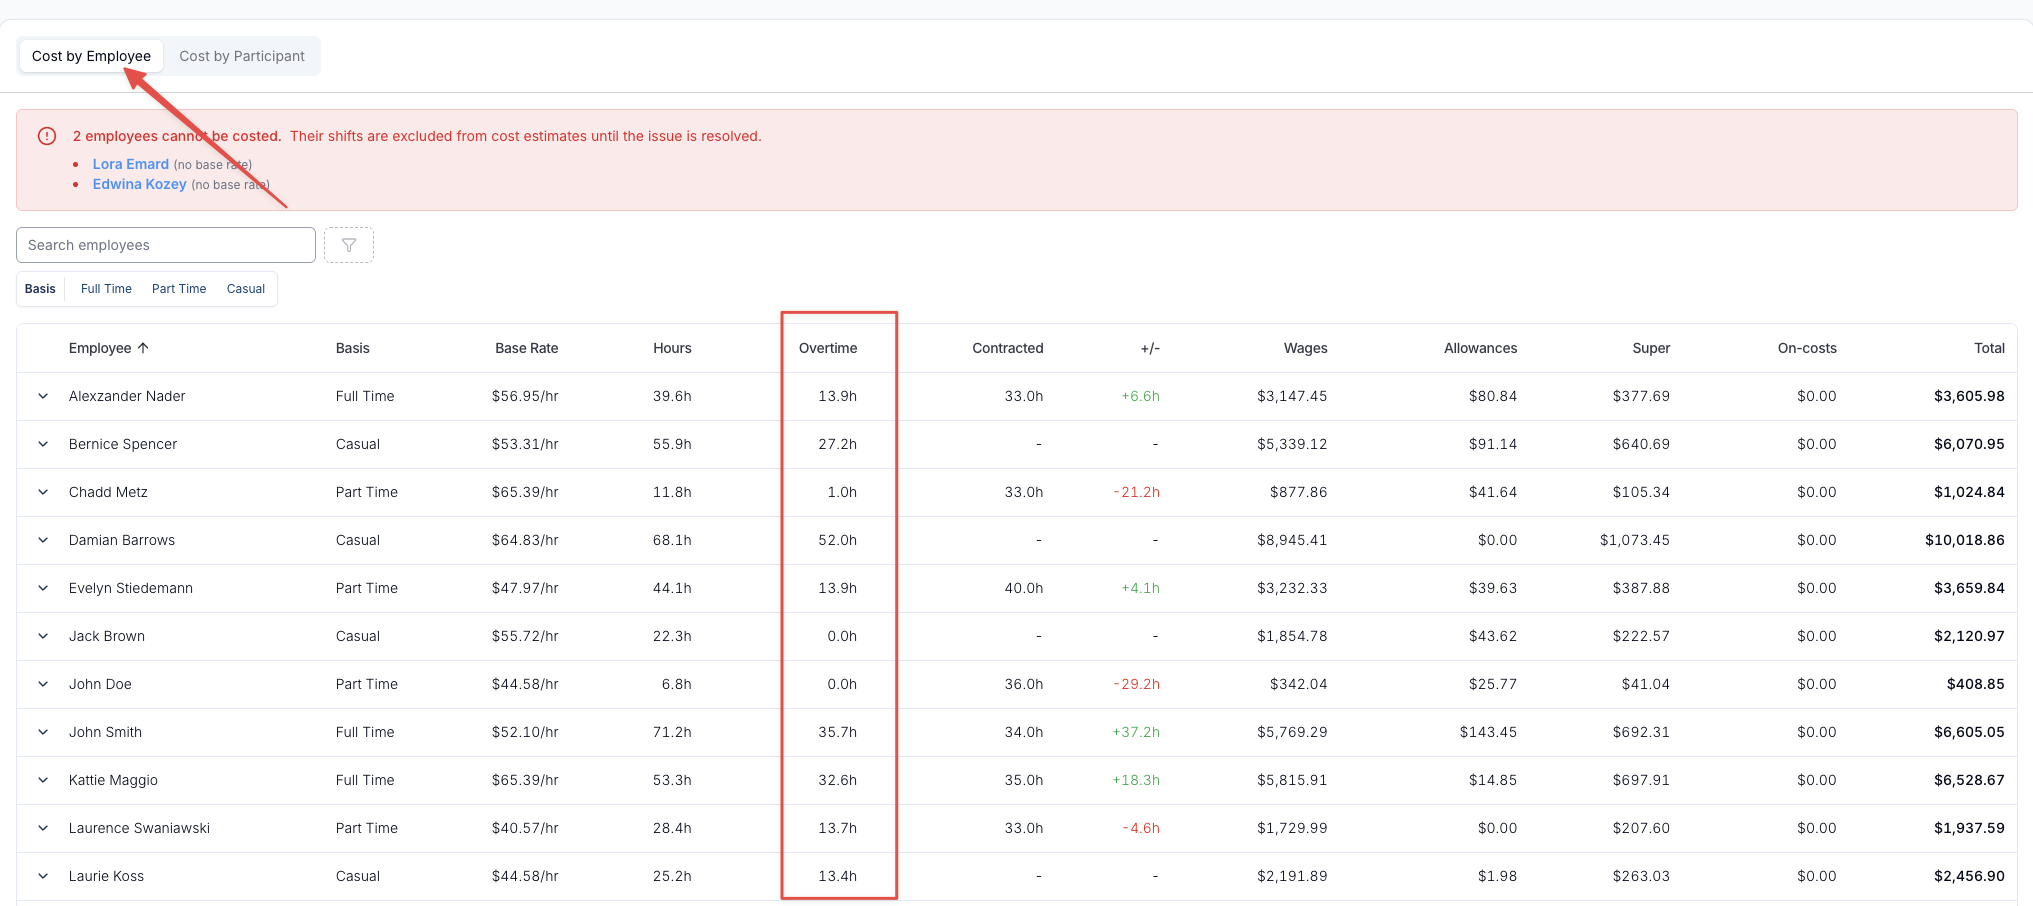
One row per employee, with these columns:
| Column | What it shows |
|---|---|
| Employee | The employee's name. |
| Basis | Full Time, Part Time, or Casual. |
| Base Rate | Their hourly base rate. If the rate changed during the period, this shows a range - hover it to see each rate and the dates it applied. |
| Hours | Total hours rostered in the period. |
| Overtime | Of those hours, how many attract overtime rates. |
| Contracted | Their contracted weekly hours, pro-rated across the reporting period. |
| +/- | Rostered hours minus contracted hours - green when they're over their contracted hours, red when they're under. |
| Wages, Allowances, Super, On-costs, Total | The cost breakdown for that employee. |
Every column is sortable. You can also search by employee name and filter by Basis.
Seeing Total Overtime Hours
Overtime here means any hours paid at an overtime rate under the award on the worker's employment contract. That's most often hours past their ordinary hours cap, but rules like active sleepover work and broken-shift spans count too. For the exact triggers, see the award rules for SCHADS, Nurses, Aged Care and Health Professionals.
There are three places to read overtime out of this report, depending on how much detail you need:
- Total for the period - the Overtime Hours summary card at the top of the report.
- Per employee, plus a total - the Overtime column on the Cost by Employee tab. A Totals row at the bottom of the table adds up Hours, Overtime, Contracted, +/- and every cost column.
- Per rate - expand an employee's row to see how their hours split across each pay rate, including the individual overtime bands.
Per-Employee Rate Breakdown
Select the chevron at the start of an employee's row to expand it. The expanded row shows a Wage table with one line per pay rate - the base rate, the multiplier applied, the hours at that rate, and the resulting cost - with a total underneath. This is where you can see how many hours landed in each overtime band rather than just the overall overtime figure.
If the employee has allowances in the period, an Allowance table appears alongside it showing each allowance, the units, and the cost.
Cost by Participant
This tab flips the view around to show cost and profitability per Participant: Hours, Wages, Allowances, Super, On-costs, Cancellation, Total Cost, Revenue, Net Profit, and Margin. A Direct Charges column also appears when your organisation uses direct charges. Rows expand here too, and every column is sortable.
Cost by Region
Use Cost by Region to compare roster cost and revenue across the Regions assigned to your workers, sites, and Participants. Each row shows:
- Region
- Hours
- Gross Wages
- Total Cost
- Revenue
- Net Profit
- Cost-to-Revenue
Search by region name or sort any column. These rows follow all report filters except Region. Selecting a Region narrows the summary, daily chart, Cost by Employee and Cost by Participant, while Cost by Region keeps the other regions for comparison.
Exporting the Figures
Actions > Export as XLSX produces a workbook with a summary, employee breakdown, Participant breakdown, region breakdown, daily breakdown, and a list of any uncostable employees. The summary sheet carries the period's Overtime Hours, and the employee sheet carries the same Hours and Overtime columns as the on-screen table, so you can total or pivot them yourself.
The Region Detail sheet follows the Cost by Region tab: it keeps every region after the other filters are applied, even when a Region filter is selected.
The Cost Schedule
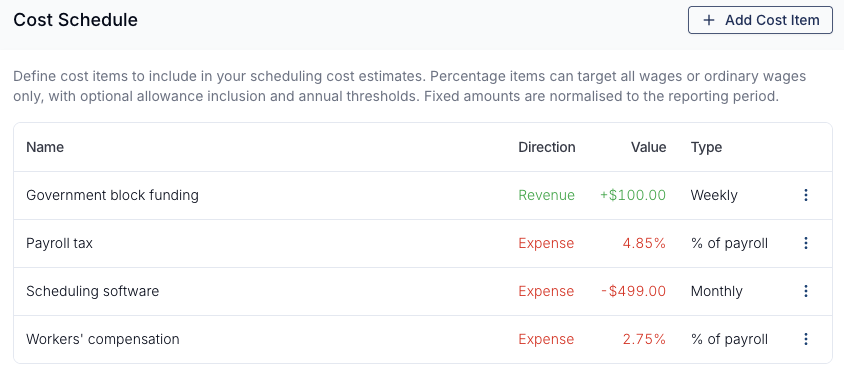
The cost schedule is where you define recurring cost and revenue items that fold into the estimates for your whole organisation. Open it from Actions > Manage Cost Schedule. Configured items also appear as chips at the top of the report - revenue in green and expenses in red.
Adding a Cost Item
Click Add Cost Item and complete the form:
- Name - a label for the item.
- Direction - choose Expense (a recurring business cost, e.g. payroll tax, insurance, or software) or Revenue (recurring income added to scheduling profitability).
- Type - % of Payroll or Fixed Amount. Revenue items must use a fixed amount.
- Value - the rate (for a percentage) or dollar amount (for a fixed amount).
- Frequency - for fixed amounts, how often the amount applies (Weekly, Fortnightly, Monthly, Quarterly, or Annual). Fixed amounts are normalised to the reporting period.
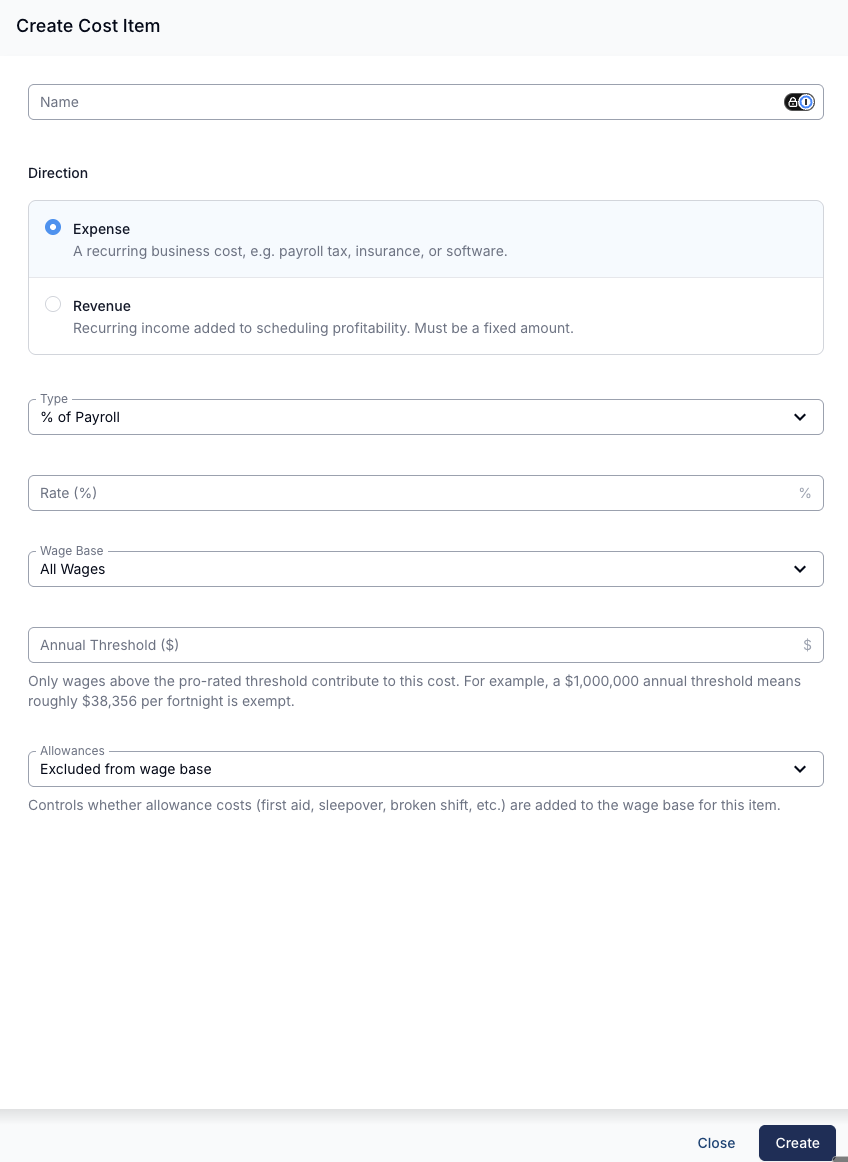
Percentage-of-payroll items have three extra options:
- Wage Base - apply the percentage to All Wages (base pay plus overtime) or Ordinary Wages Only (standard, non-overtime hours).
- Annual Threshold - only wages above the pro-rated threshold contribute to the cost. For example, a $1,000,000 annual threshold means roughly $38,356 per fortnight is exempt. Useful for tiered costs like payroll tax.
- Allowances - control whether allowance costs (first aid, sleepover, broken shift, etc.) are added to the wage base for this item.
Tracking Additional Revenue
Beyond the revenue Astalty already calculates from Participant charges, you can record recurring income so the report reflects a true profit rather than just costs. Revenue items show in green with a + and feed into Additional Revenue, Net Profit, and the Cost-to-Revenue ratio.
There are two places to add revenue:
- Provider-wide - add a Revenue cost item in the cost schedule for income that isn't tied to a single site.
- On a SIL house - record income against a specific site (e.g. Participant rent contributions) so the report shows that house's real profit, not just its expenses.
Adding Revenue on a SIL House
Site cost items live on the site's Cost Items tab:
- Open the SIL house site and go to the Cost Items tab.
- Click Add Cost Item.
- Set the Direction to Revenue (recurring income for this site, e.g. Participant rent contributions) or Expense (a recurring cost for the site, e.g. rent, power, or internet).
- Enter the Amount and a Frequency (Weekly, Fortnightly, Monthly, Quarterly, or Annual).
Site cost items are always fixed amounts. When you filter the Scheduling Costs report to that site, its items appear as chips alongside the provider-wide cost schedule and are included in the totals.