- Forms & Quality
- Manage Forms
- Viewing a Form's Report
Viewing a Form's Report
Overview
The Report tab gives you an at-a-glance summary of every submission to a form. Instead of reading responses one by one, the report turns all of your submissions into charts and statistics so you can quickly spot trends across the whole form.
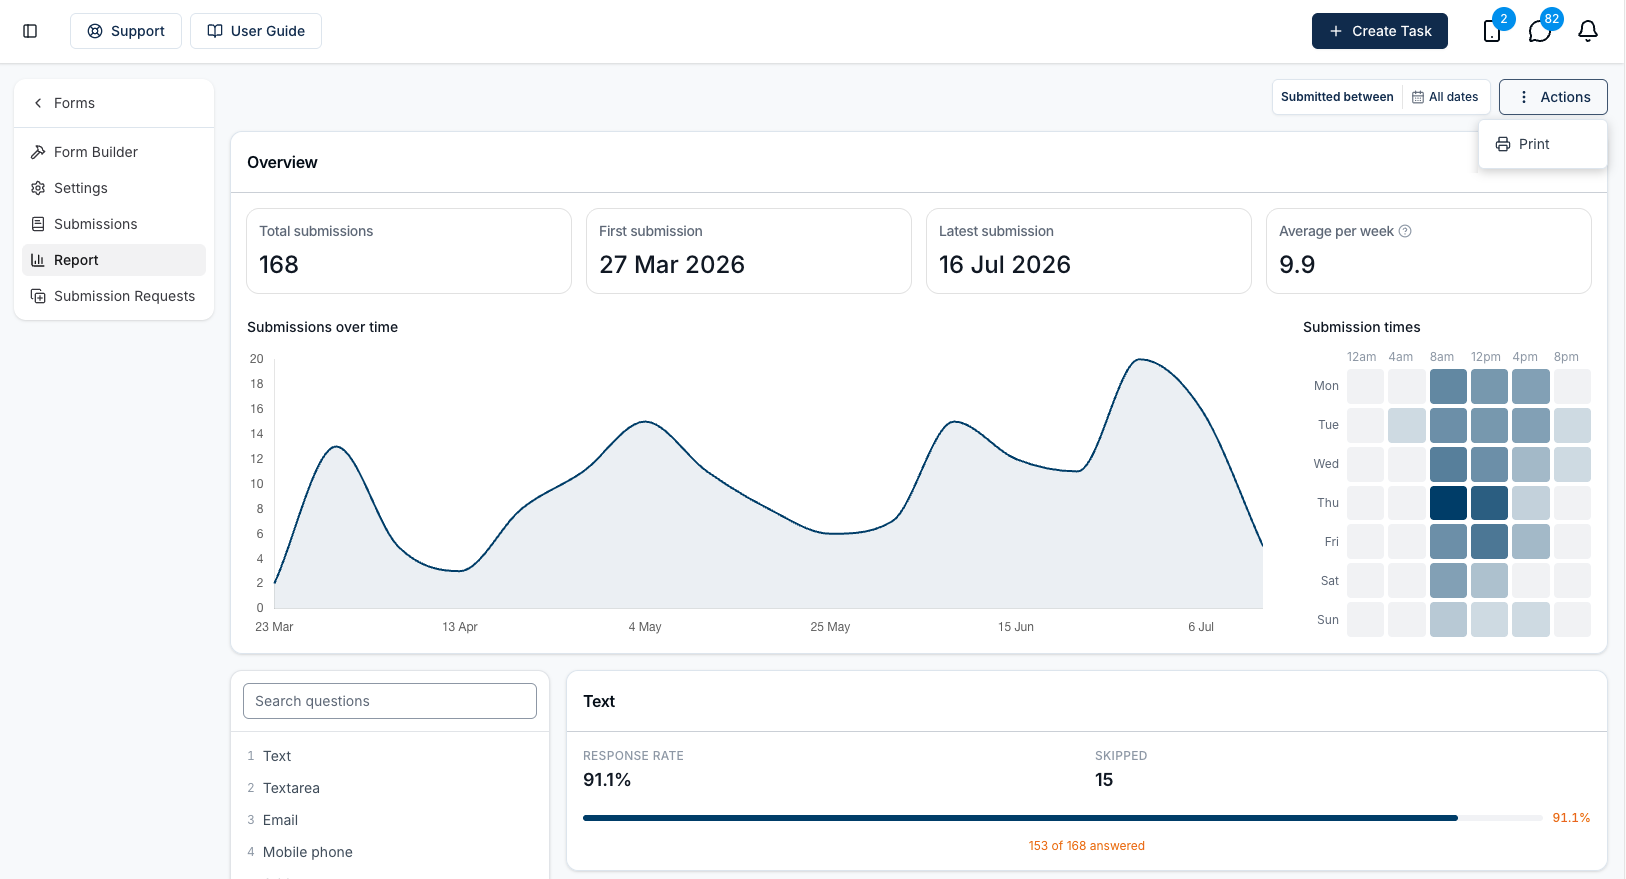
To open it, go to Forms → Manage Forms, open the form you want, and select the Report tab (it sits between Submissions and Submission Requests). Like submissions, the report only shows data for the Participants you have access to.
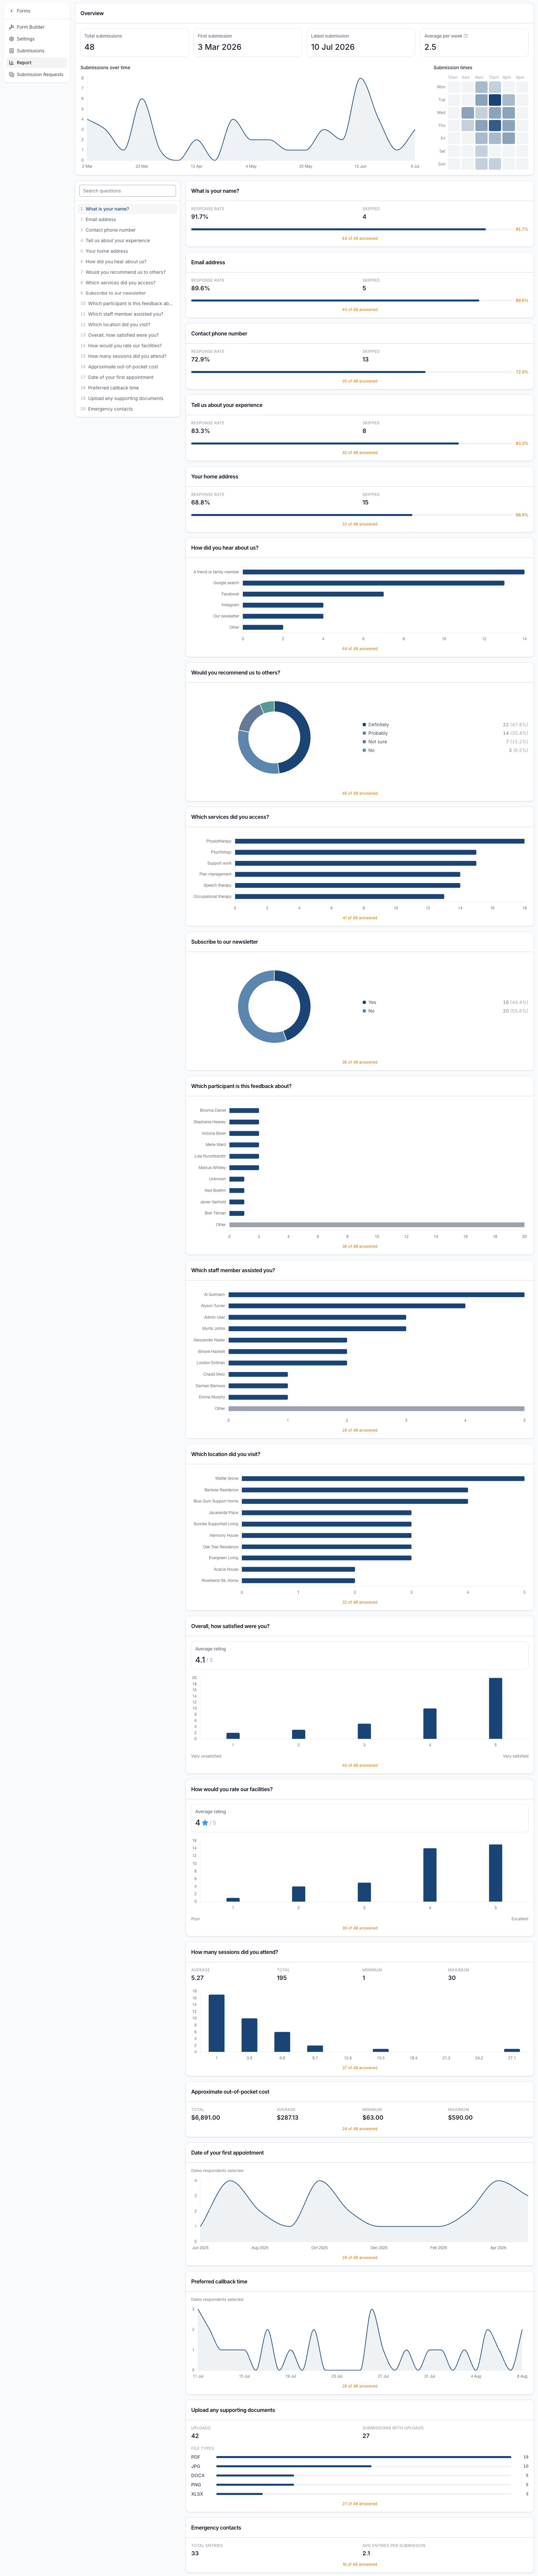
The Overview section
At the top of the report you'll find a summary of the whole form:
- Total submissions - how many times the form has been submitted.
- First submission - the date of the earliest submission.
- Latest submission - the date of the most recent submission.
- Average per week - total submissions divided by the number of weeks between the first and latest submission.
- Submissions over time - a line chart showing how submissions have trended.
- Submission times - a heatmap showing which days of the week and times of day submissions usually come in.
A card for every question
Below the overview, each question in the form has its own card, shown in the same order as the form. Every card shows how many people answered that question (for example, 44 of 48 answered) and turns the responses into the most useful view for that question type:
- Multiple choice, dropdowns and checkboxes - a donut or bar chart showing how often each option was chosen.
- Rating and linear scale - a histogram with the average score.
- Number - the count, total, average, minimum and maximum, plus a distribution chart.
- Currency - the total, average, minimum and maximum of the amounts entered.
- Date - a chart of the dates respondents selected.
- File upload - how many files were uploaded and the file types.
- Repeater - the total number of entries and the average entries per submission.
- Free-text questions (text, long text, email, phone and address) - the response rate and the number of respondents who skipped the question.
If a question hasn't been answered by anyone yet, its card will show No answers yet. Questions that have since been archived still appear in the report with an Archived badge so your historical data stays complete.
Finding a question quickly
On larger screens, a question navigation menu runs down the left of the report and lists every question in form order. Start typing in the search box to filter the list, then click a question to jump straight to its card. The menu highlights the question you're currently looking at as you scroll.
Narrowing the Report to a Date Range
Submitted between at the top of the report sets the period every figure is calculated over - the overview stats, both charts and every question card. It starts on All dates.
- Select the date shown beside Submitted between.
- Switch between Last and This, then pick Week, Fortnight, Month, Quarter or Year - or choose your own start and end dates on the calendar.
With a range set, the arrows either side of it step back and forward one period at a time, and the cross clears it. If nothing was submitted in the range, the report shows No submissions in this date range in place of the charts, and Actions stays hidden until the range contains a submission.
Printing the Report or Saving It as a PDF
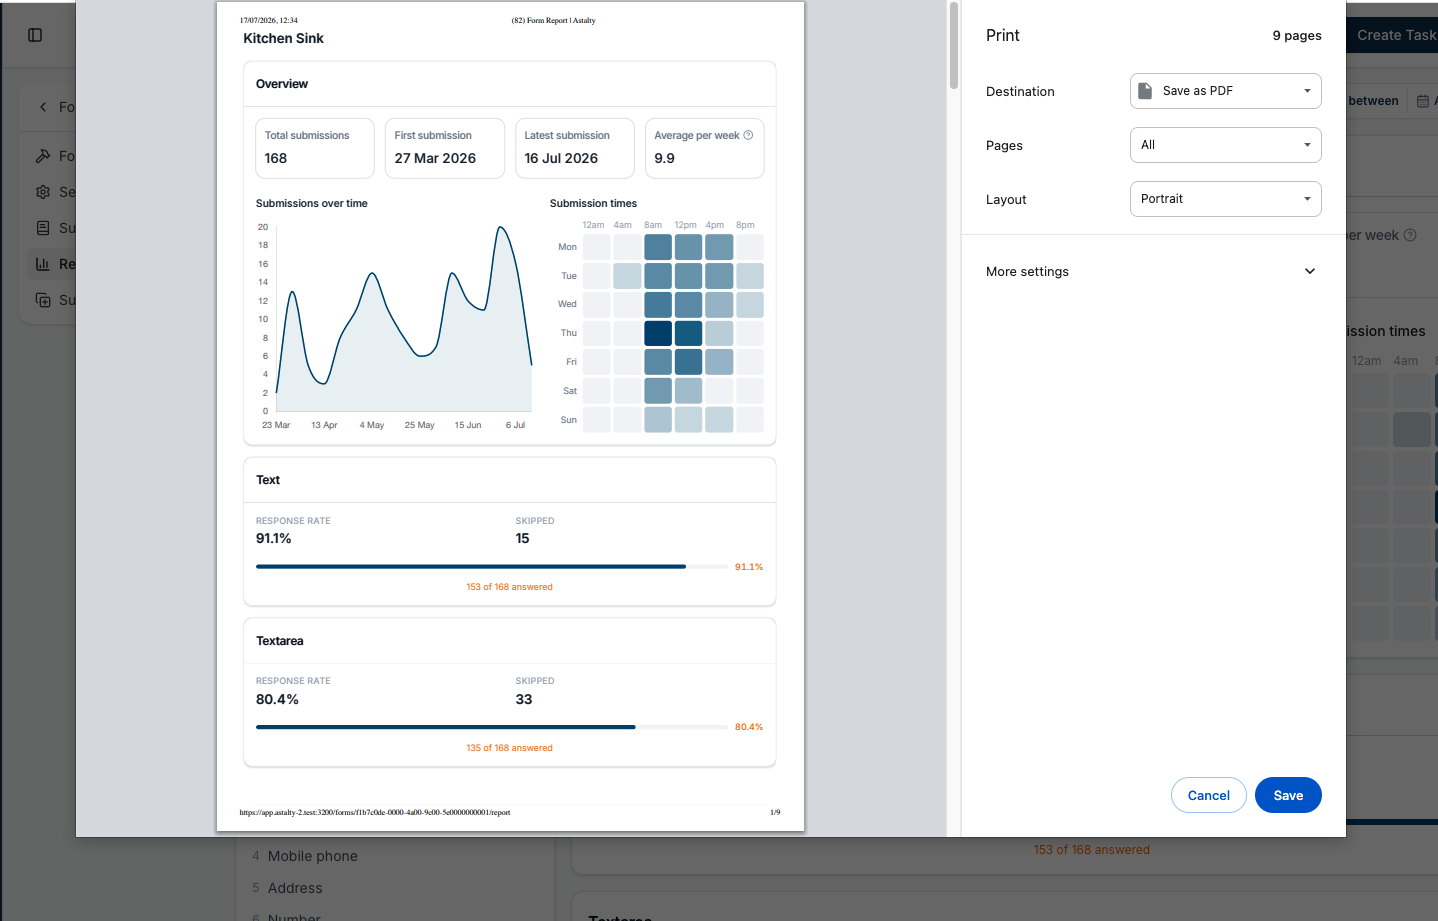
Select Actions → Print to send the report to your printer, or choose Save as PDF as the destination in your browser's print dialog to keep a copy.
The printed copy contains the overview and every question card, laid out across pages so no card is split by a page break. Astalty's menus, the Submitted between filter and the question navigation are left out. The form's name sits at the top, with the date range beneath it when the report is filtered.